
Trade implications of the Red Sea disturbance; outlook on monetary policy and rupee
With the Israel-Hamas war continuing to simmer in the backdrop, global trade is now confronting fresh concerns in the Red Sea trade route. We take a cursory look at these developments to assess the potential on India’s merchandise trade, esp. exports. This is followed by a quick assessment of US monetary policy along with the outlook on Indian rupee.
1. Can the Red Sea disturbance lead to trade distress?
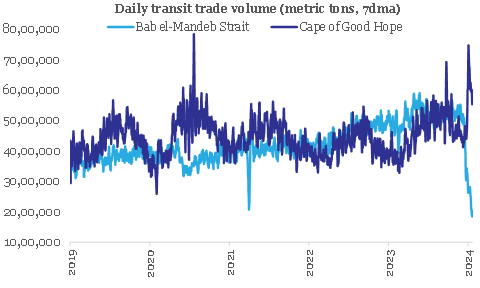
Global supply chains have started facing disruption as maritime activity in the Red Sea region has dropped significantly following attacks by Houthis (a Yemen based rebel group, which is known to be backed by Iran, has declared its support for Hamas) on commercial vessels since the middle of Dec-23. The Red Sea region is a systemically important shipping lane that facilitates about 11% of global maritime trade volume as per the IMF. The key chokepoint lies around the Bab el-Mandeb Strait area, which in turn is connected to the Suez Canal, and is an important conduit for global maritime trade, connecting regions like Asia, Middle East, West & North Africa, Europe, and US East Coast.
The ongoing attack by Houthis is forcing shipping vessels to divert to a much longer route around Africa’s Cape of Good Hope. As such, the daily transit trade volume in the Bab el-Mandeb Strait area has dropped by 59% (from 4990 th metric ton to 2040 th metric ton) since the attacks in Dec-23. In the meantime, the Cape of Good Hope has seen an increase in maritime activity by 38% (from 4328 th metric ton to 5964 th metric ton), which has helped to partially offset the overall drag on global maritime trade activity.
Chart 1: Disruption in Red Sea is leading to re-routing of global maritime trade
Source: IMF PortWatch, QuantEco Research
This rerouting of global maritime trade is likely to have increased transit time by 2-3 weeks, while also resulting in a price escalation (manifested in the form of higher cost for freight, insurance, etc.).
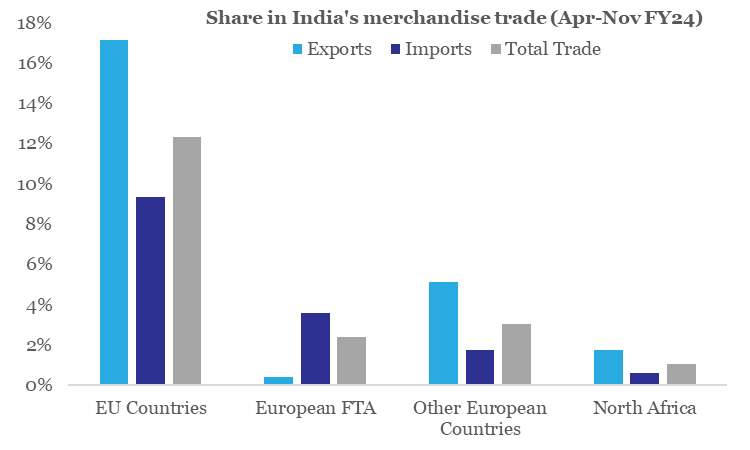
From India’s perspective, although it’s still early to assess the situation from an economic perspective, one needs to be watchful and cautious of the emerging dynamics of the Red Sea disturbance. Nevertheless, one could monitor India’s trade with Europe and North Africa that is likely to be the most impacted from Red Sea disturbance.
- Europe and North Africa had a share of 17.8% and 1.1% in India’s total trade during Apr-Nov FY24 respectively. India had a larger share of merchandise exports (at 22.7%) going to Europe and North Africa (1.8%) compared to merchandise imports from Europe (14.7%) and North Africa (0.6%) respectively during Apr-Nov FY24.
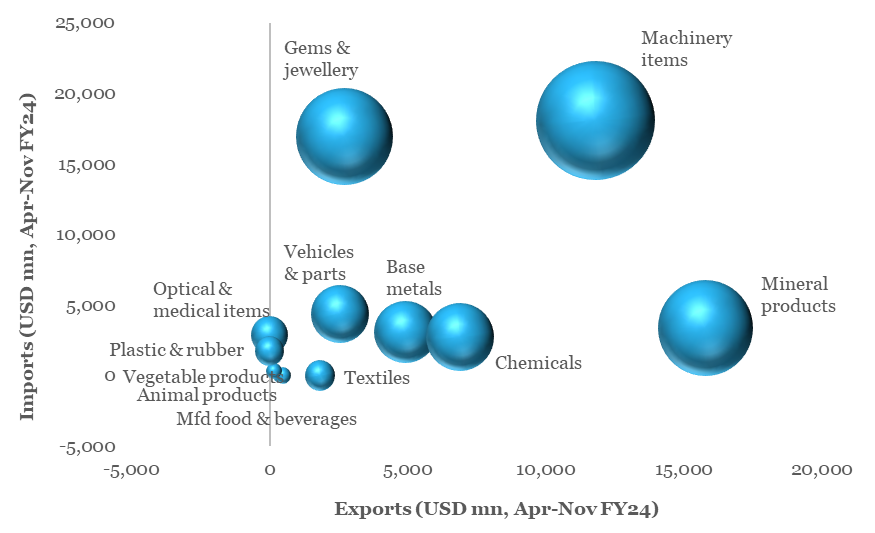
- Key goods traded include Machinery items, Gems & jewellery, Mineral fuels, Chemicals, Base metals, Vehicle parts, Optical & medical items, Textiles, etc.
Chart 2: India’s trade with Europe and North Africa would be most vulnerable to the Red Sea disturbance
Source: CEIC, QuantEco Research
For India, 2023 has been dismal for exporters, with cumulative exports seeing a ~5% contraction (data available until Nov-23) in value terms over 2022. A cursory glance at India’s headline export performance since 2009 reveals a higher frequency of contraction compared to the earlier period. The 15-year period between 1994-2008 saw just one year of export contraction for India. In contrast, the 15-year period between 2009-2023 saw seven episodes of contraction in India’s exports – that’s almost 47% of the time! Rise of trade protectionism and shortening of global business cycle since the 2008 Global Financial Crisis (besides one-off factors like COVID) appear to have significantly weighed on external trade sentiment.
Chart 3: Key category of traded goods vulnerable to Red Sea disturbance
Source: CEIC, QuantEco Research
Note:
(i) Exports and imports represent Top 10 items of India’s trade with Europe and North Africa,
(ii) Size of the bubble denotes value of total trade
Since there is likely to be a cost escalation (which could get passed on if uncertainty persists), the overall impact will depend on price elasticity of individual traded items – in this case low margin items could be vulnerable, while items with solid demand might not feel any pinch. One also needs to consider the impact on quality degradation from delay in trade of agriculture and food related items. Further, the impact could also be felt to extent on India’s trade with US (esp. consignment directed to/from the east coast).
2. Outlook on monetary policy
After maintaining a pause for three consecutive monetary policy reviews between Sep-Dec 2023, the US Federal Reserve is widely expected keep fed fund rate range unchanged at 5.25-5.50% in its forthcoming policy review meeting on Jan 31, 2024. While market participants expect 125-150 bps of cumulative rate cut by the Fed before the end of 2024, recent spate of relatively strong-to-mixed economic data has pushed forward the expected timing of first rate cut from Mar-24 to May-24.
This is somewhat in line with our expectation that the likelihood of an early reversal of the rate tightening cycle by the Fed is relatively low on account of residual inflationary pressures amidst slower than anticipated loss of growth momentum. As such, we continue to expect the Fed to start its rate cutting cycle from Jun-24 onwards.
3. Rupee view
After facing persistent, albeit mild depreciation pressure over five consecutive months, INR is finally trying to recoup some of its losses. It appreciated by 0.2% in Dec-23 (closing the month at 83.21) and has gained another 0.1% in the month of Jan-24 so far (currently trading close to 83.15 levels).
- We continue to believe that INR could remain supportive in Q4 FY24 on account of favorable year-end seasonality and market positioning ahead of India’s inclusion in JPM EM bond index (from Jun-24).
- While global geopolitical risk and domestic election related uncertainties remain on the table, the tail risks have reduced significantly amidst range-bound movement in commodity prices and the recently concluded state elections (that on aggregate basis went in favor of the incumbent BJP government at the centre).
- Notwithstanding the gyrations in market sentiment, the expectation of interest rate easing by the US Fed remains intact. This is bound to be supportive of emerging market currencies in the near-term.
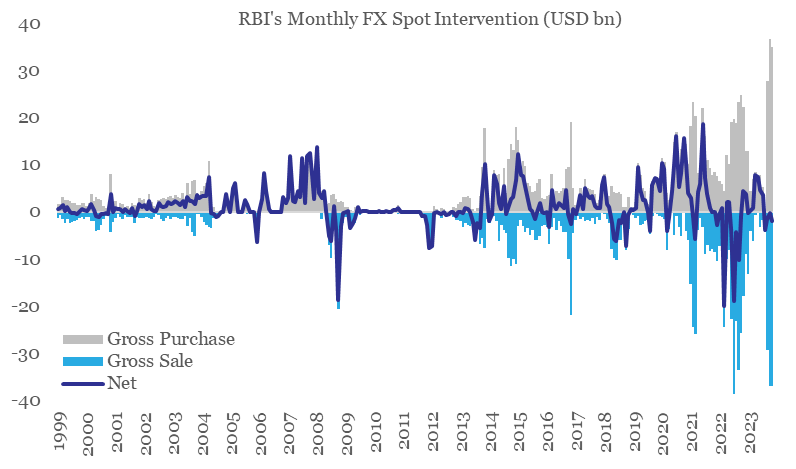
Although the factors for a mild near-term appreciation in INR are emerging, we believe it is unlikely to result in a durable trend due to RBI’s active intervention in the FX market (during Sep-Nov 2023, the central bank cumulatively bought and sold record high amount of USD 99 bn and USD 103 bn on average gross basis respectively, even as the cumulative net intervention was at a paltry USD 3.7 bn of sold position). In addition, Fed’s rate easing cycle in 2024 would soon be followed by key central banks over the medium term, thereby reducing the current bearishness on the USD.
Chart 4: In recent months, FX market has seen record levels of intervention from the RBI
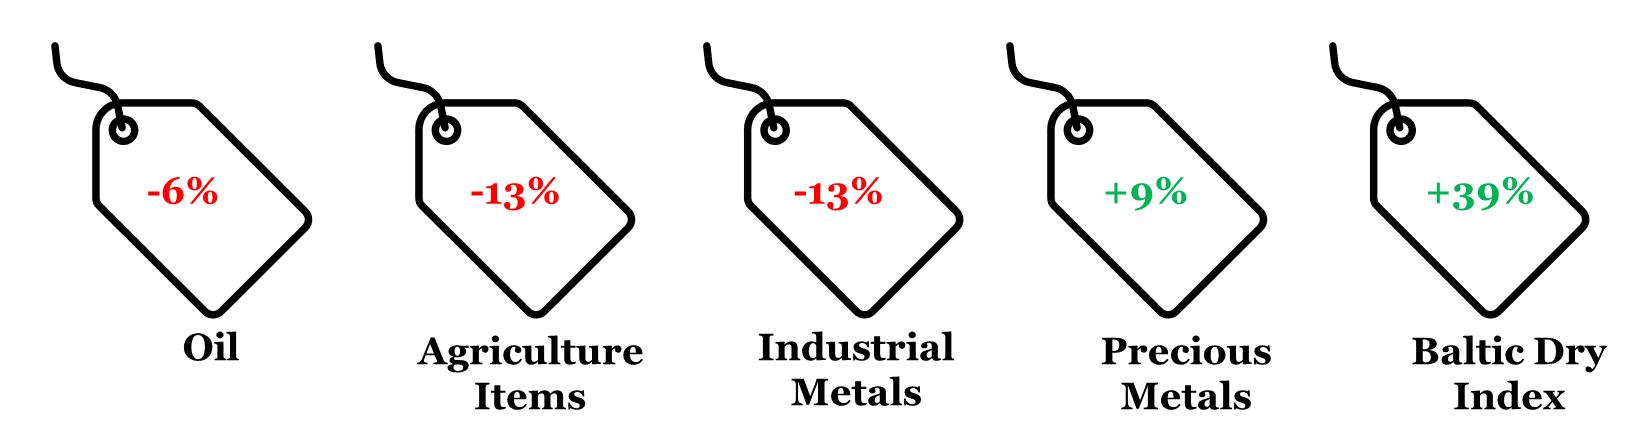
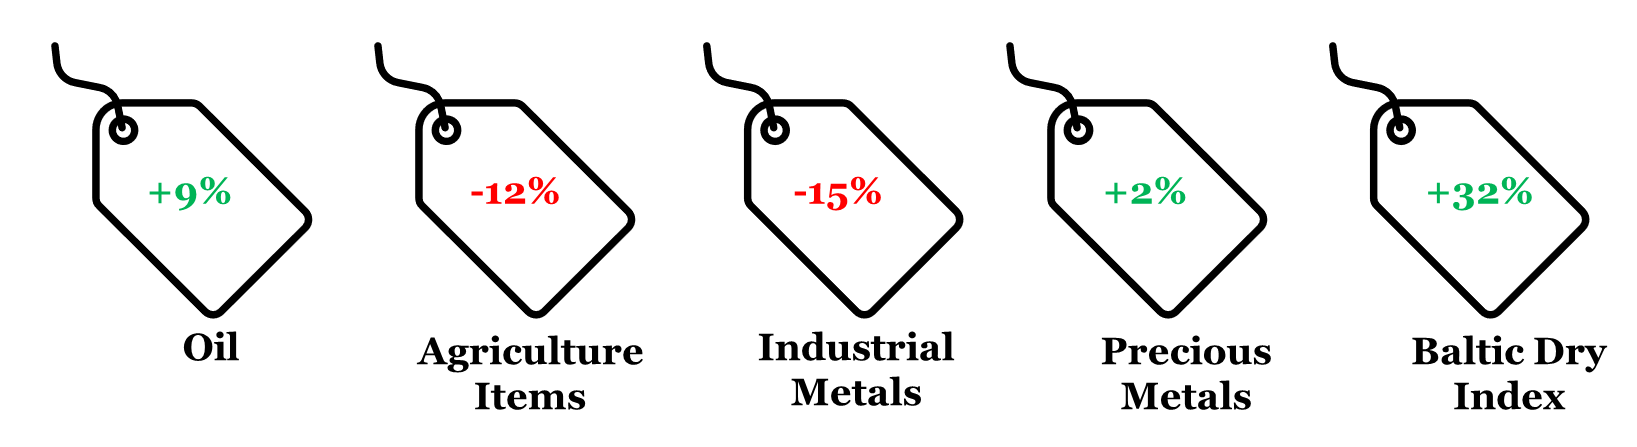
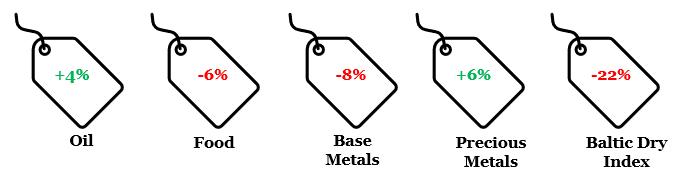
4. CYTD price change in key commodity groups and shipping cost
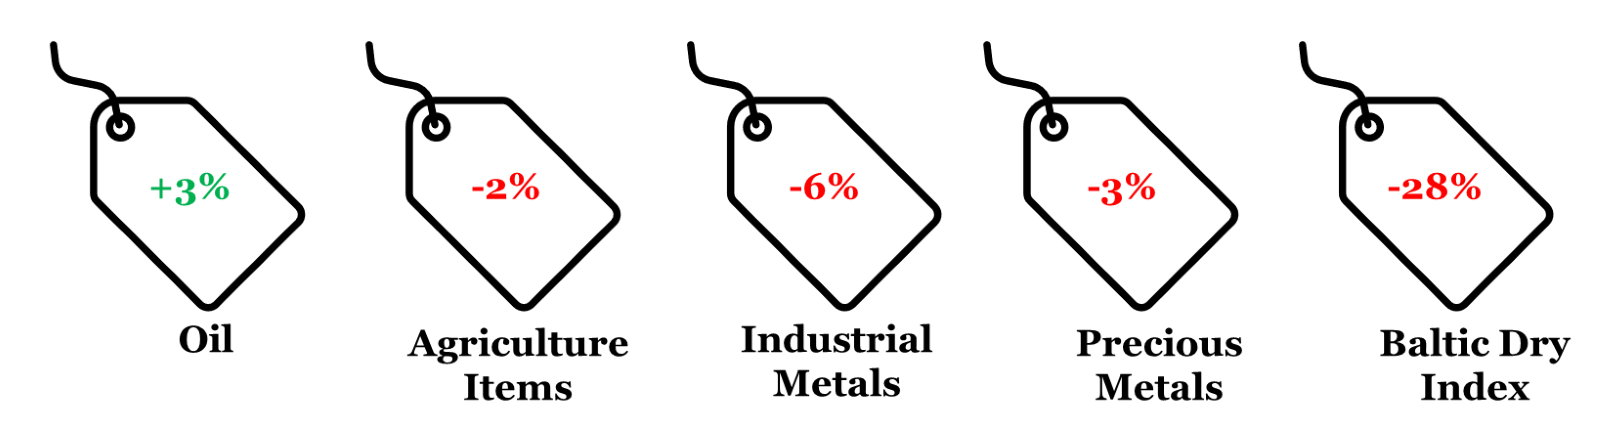
Note: (i) Price change is between Jan 22, 2024 and Dec 31, 2023; (ii) Oil price is represented by Brent; (iii) Agriculture Items, Industrial Metals, and Precious Metals are represented by respective Bloomberg Commodity indices; (iv) rounded off figures represented.
Data: Refinitiv, QuantEco Research

Winners and losers of global merchandise trade in 2023; outlook on monetary policy and rupee
The simmering of Israel-Hamas war continues to provide sporadic jitters to world trade. With 2023 coming to an end, we offer a bird’s eye view of merchandise trade performance. This is followed by a quick assessment of US monetary policy along with the outlook on Indian rupee.
1. 2023 global merchandise: Winners and losers
World merchandise trade experienced a decline through 2023 on account of moderation in demand as well as commodity prices. As per the UNCTAD (United Nations Conference on Trade and Development), the value of world merchandise trade is estimated to contract by approximately USD 2 trillion, representing a 7.5% fall compared to 2022.
On volume basis, while the aggregate picture is less sombre (as per CPB Netherlands, global merchandise trade expanded by 0.1% between Oct-23 and Dec-22), it is predominantly being driven by China and US. In contrast, Europe has performed poorly (amidst concentration of recent geopolitical risks), while Japan has nearly struggled to maintain last year’s run rate.
Chart 1: Among key economies, Eurozone and UK seem to have borne the brunt of trade slowdown in 2023
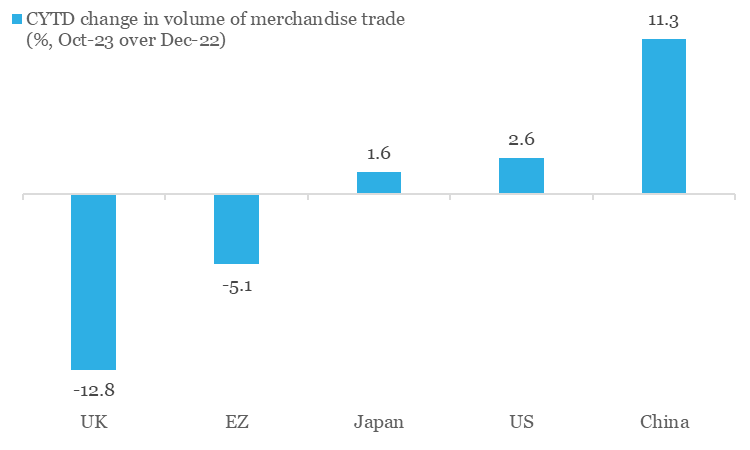
Source: CPB Netherlands, QuantEco Research
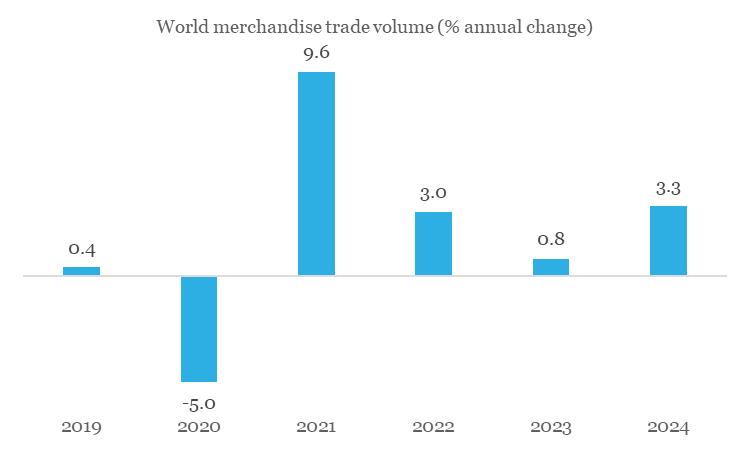
The upcoming year offers a sliver of hope with most multilateral bodies projecting a moderate recovery in world merchandise trade – as per the WTO, volume of global merchandise trade is projected to increase by 3.3% in 2024 compared to an estimated growth of 0.8% in 2023. Having said, there are notable risks that could continue impeding recovery in world trade:
- On aggregate basis, the IMF expects World GDP growth to post a mild moderation to 2.9% from an estimated level of 3.0% in 2023. Lagged impact of tight financial conditions, simmering geopolitical risks (like the recent disturbance in the Red Sea trade route) and volatility in commodity prices could continue to provide uncertainty.
- Trade protectionism has risen sharply in 2023. The resurgence in the use of industrial policy and the urgency of meeting climate commitments are driving changes in trade policies, both in the form of tariffs and non-tariff measures.
Chart 2: Protectionism continues to rise, inflicting harm on global trade
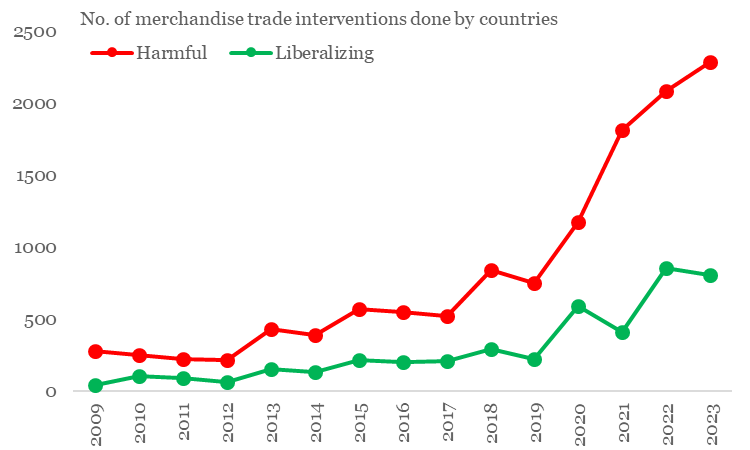
Source: GTA, QuantEco Research
For India, 2023 has been dismal for exporters, with cumulative exports seeing a ~5% contraction (data available until Nov-23) in value terms over 2022. A cursory glance at India’s headline export performance since 2009 reveals a higher frequency of contraction compared to the earlier period. The 15-year period between 1994-2008 saw just one year of export contraction for India. In contrast, the 15-year period between 2009-2023 saw seven episodes of contraction in India’s exports – that’s almost 47% of the time! Rise of trade protectionism and shortening of global business cycle since the 2008 Global Financial Crisis (besides one-off factors like COVID) appear to have significantly weighed on external trade sentiment.
Chart 3: Frequency of India’s export contraction has increased in last few years
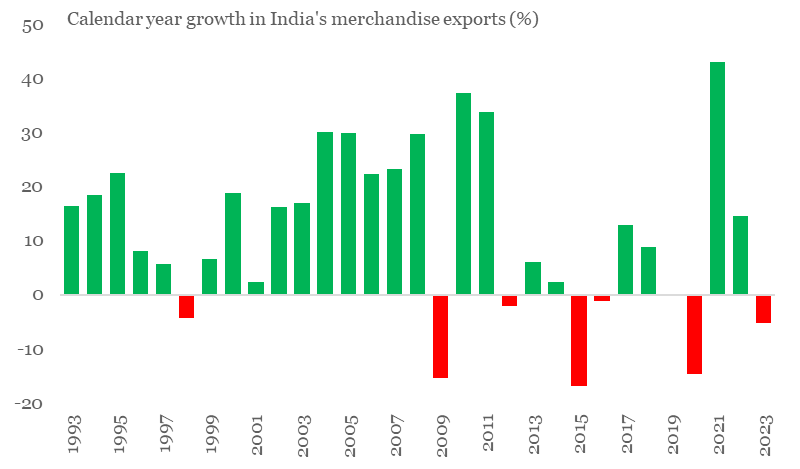
Source: CEIC, QuantEco Research
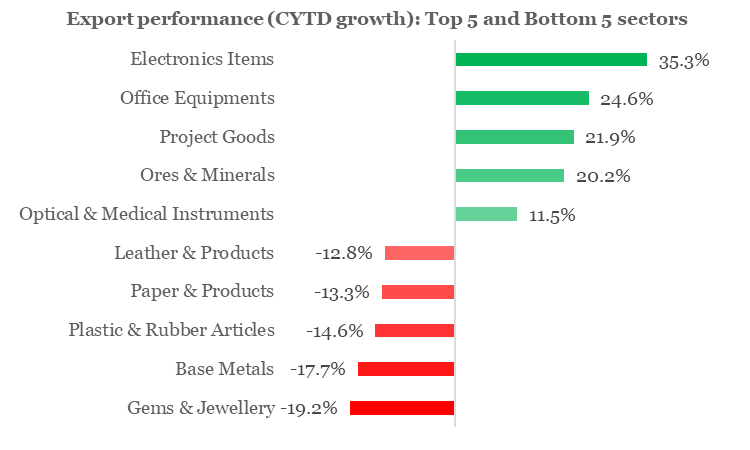
Looking one level beneath the surface, we find that export of Electronic Items has so far had a fantastic performance in 2023 with a robust growth of 35.3% YoY (led by telecom instruments), while the Gems & Jewellery sector, with a contraction of 19.2% YoY (primarily on account of pearls and other precious/semi-precious stones), bore the maximum brunt.
Chart 4: India’s exports in 2023: What went and down
Source: CEIC, QuantEco Research
2. Outlook on monetary policy
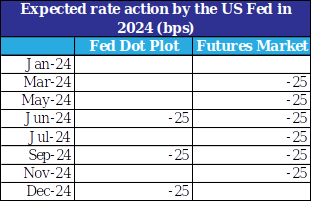
Along the expected lines, the US Fed maintained status quo on policy rates at its Dec-23 policy review. This marks the third consecutive meeting of no rate action by the Fed, with fed funds rate range being maintained at 5.25-5.50%. However, the highlight of the meeting was the projection of cumulative 75 bps rate cuts by the FOMC (Federal Open Market Committee) members in 2024, an upward revision from 50 bps earlier in Sep-23. This was perceived as a dovish signal by market participants, who have now started to price in 125-150 bps of cumulative rate in 2024, with 93% implied probability (derived from fed funds futures) of first rate cut in Mar-24.
We continue to believe that the likelihood of an early reversal of the rate tightening cycle by the Fed is relatively low on account of residual inflationary pressures amidst slower than anticipated loss of growth momentum. As such, we continue to expect the Fed to start its rate cutting cycle from Jun-24 onwards.
3. Rupee view
After facing persistent, albeit mild depreciation pressure over five consecutive months, INR is finally trying to recoup some of its losses. This is broadly in line with our moderately constructive call on INR (82.5 levels by Mar-24).
- The dovish Fed policy outcome in Dec-23 has fuelled risk-on sentiment, thereby putting pressure on the US dollar, while benefiting other currencies, including the INR.
- We continue to believe that INR could remain supportive in Q4 FY24 on account of favorable year-end seasonality and market positioning ahead of India’s inclusion in JPM EM bond index (from Jun-24).
- While global geopolitical risk and domestic election related uncertainties remain on the table, the tail risks have reduced significantly amidst range-bound movement in commodity prices and the recently concluded state elections (that on aggregate basis went in favor of the incumbent BJP government at the centre).
Although the factors for a mild near-term appreciation in INR is emerging, we believe it is unlikely to result in a durable trend due to RBI’s active intervention in the FX market (during Sep-Oct 2023, the central bank bought and sold record high amount of USD 32 bn and USD 33 bn on average gross basis respectively, even as net intervention averaged at a paltry USD 0.9 bn of sold position). In addition, Fed’s rate easing cycle in 2024 would soon be followed by key central banks, thereby reducing the current bearishness on the USD.
Table 1: Market participants are more gung-ho about their Fed rate cut expectations vis-à-vis the FOMC members
Note: Fed rate action has been averaged basis cumulative projection of 75 bps cut by the FOMC
Data: FOMC, Refinitiv, QuantEco Research
4. CYTD price change in key commodity groups and shipping cost
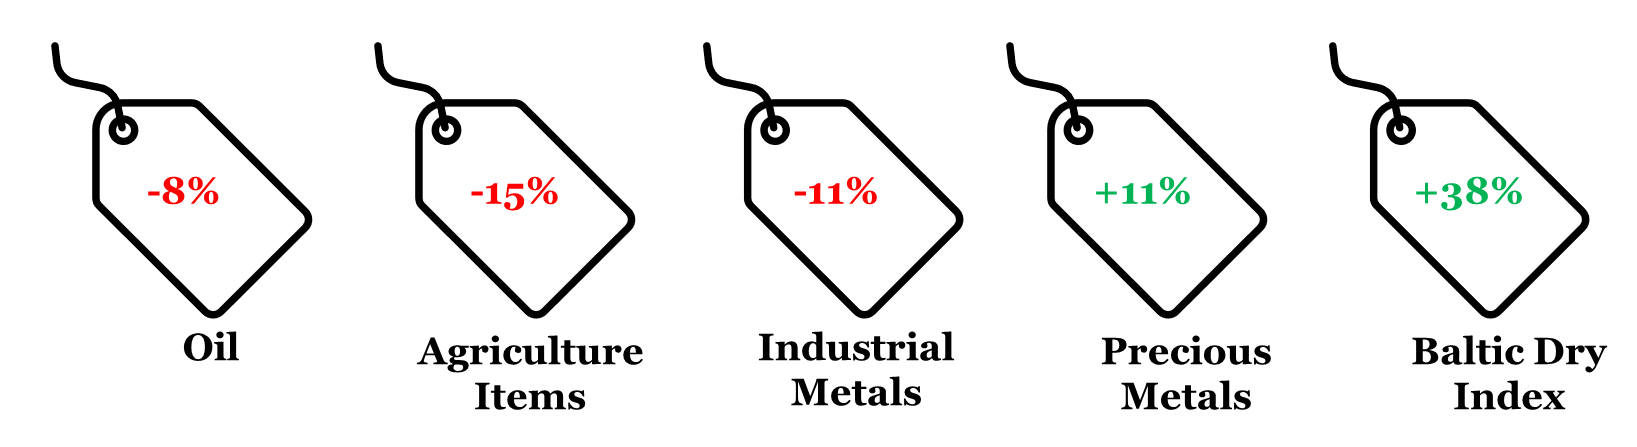
Note: (i) Price change is between Dec 22, 2023 and Dec 31, 2022; (ii) Oil price is represented by Brent; (iii) Agriculture Items, Industrial Metals, and Precious Metals are represented by respective Bloomberg Commodity indices; (iv) rounded off figures represented.
Data: Refinitiv, QuantEco Research

Dark clouds with a silver lining marks global trade; outlook on monetary policy and rupee
Even as the Israel-Hamas war continues to simmer, tail risks for global trade have not yet acquired baseline characteristics. In this issue we highlight the emergence of a silver lining for global and Indian trade, while remaining cautious of the impending wave of slowdown. This is followed by a quick assessment of US monetary policy along with the outlook on Indian rupee.
1. Global merchandise trade: Dark clouds with silver lining
The World Trade Organization downgraded its forecast for growth in volume of world merchandise trade in 2023 to 0.8% vis-à-vis its earlier estimate of 1.7% in Apr-23. Slowdown in merchandise trade appears to be broad-based, involving many countries and a wide array of goods, esp. “certain categories of manufactures such as iron and steel, office and telecom equipment, textiles, and clothing”. A notable exception is passenger vehicle segment, sales of which have surged in 2023 so far. It appears that high inflation, tight monetary policy, dollar strength, and persistent geopolitical tensions have weighed upon global trade sentiment.
Chart 1: The WTO outlines a sombre near-term outlook for global trade
Source: WTO, QuantEco Research
While the forecast for 2023 appears sombre, there is a silver lining too:
- Global supply chains have now reverted to their baseline values that existed prior to the pandemic. This suggests that supply conditions have normalised after pandemic-related disruptions over the last three years. Falling input and output prices also suggest that global inflationary pressures are waning.
- WTO’s forecast for 2024 offers hope of recovery in global trade. If the forecast for 2024 is realised, then “Asia would be the fastest growing region on both the export and import sides”.
Chart 2: Global supply chain conditions have normalized after the pandemic related disruptions
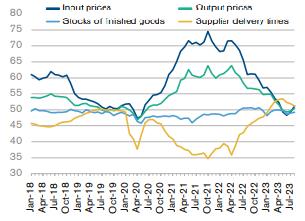
Source: WTO, QuantEco Research
From India’s export perspective, we see this translating into tapering of contractionary pressure. On 3-month rolling basis, India’s merchandise exports grew by 2.3% YoY in Oct-23, marking its first expansion in 9-months.
Chart 3: India’s merchandise exports are showing early signs of expansion
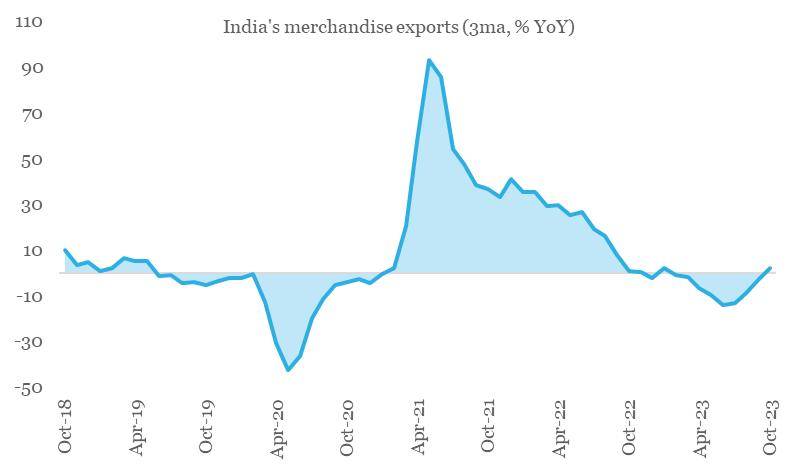
Source: CEIC, QuantEco Research
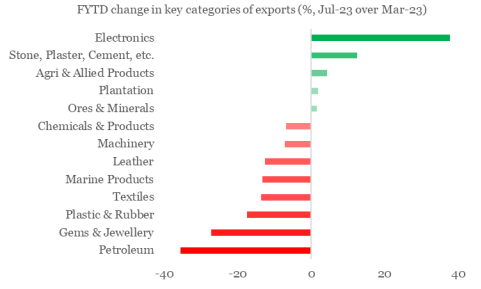
The expansion in Oct-23 appears nearly broad-based. Barring plantation products and electronic items, all other subcategories of merchandise exports have shown an improvement in momentum on 3-month average basis. Improvement in last 3-months has been led by (i) Stone, plaster, cement, etc., (ii) Ores & minerals, (iii) Petroleum products, (iv) Marine products, (v) Textiles, (vi) Plastic & rubber items, (vii) Machinery items, and (viii) Gems & jewellery.
Chart 2: Recent improvement in India’s export momentum appears almost broad-based
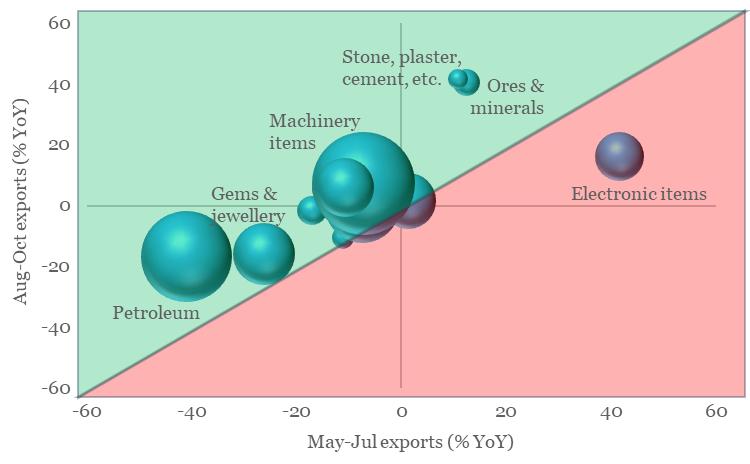
Note: Size of the bubble corresponds to respective share in FY23 merchandise exports
Source: CEIC, QuantEco Research
2. Outlook on monetary policy
Along expected lines, the US Fed maintained status quo on policy rates at its Nov-23 policy review. For the first time in the current tightening cycle, the FOMC skipped hiking policy rate for two consecutive meetings. Although the Fed has retained flexibility to hike one more time, recent incoming economic data from the US suggests a softening bias on both activity and prices front.
Market participants are currently attaching a peak rate hike probability of just ~14% in the Jan-24 policy review. Thereafter, market participants are attaching a rate cut probability of ~66% for Jun-24 policy review.
We concur with the consensus view and continue to expect a turn in the US monetary policy cycle by mid-2024. This should allow other central banks to follow suit, with RBI likely to opt for its first rate cut in Q2 FY25.
3. Rupee view
In line with our expectations, INR continues to trade close to its record low levels vs. the USD, accompanied by subdued volatility. Factors weighing upon INR from near term perspective:
- India’s monthly merchandise trade deficit touched a record high level of USD 31.5 bn in Oct-23.
- Foreign investment flows (both FDI and FPI) have been subdued in recent months, possibly on account of uncertainty on US rate trajectory and elevated geopolitical risks.
While this could push INR towards a fresh all-time low of close to 84 levels (vs. the USD) by Dec-23, we note that pressure for further weakness in INR could no longer be binding in the coming weeks.
Emergence of signs of softening in US economy coupled with contained impact (so far) of Israel-Hamas war bodes well for a reversal in the INR trajectory. In the absence of fresh escalation of geopolitical risks, we continue to expect INR to partially reclaim lost ground and move towards 82 levels in Mar-24 amidst favorable Q4 seasonality and anticipated USD weakness as market participants position for a pivot in US monetary policy cycle by mid-2024.
Chart 4: Dollar and crude oil have corrected sharply in last 1-month
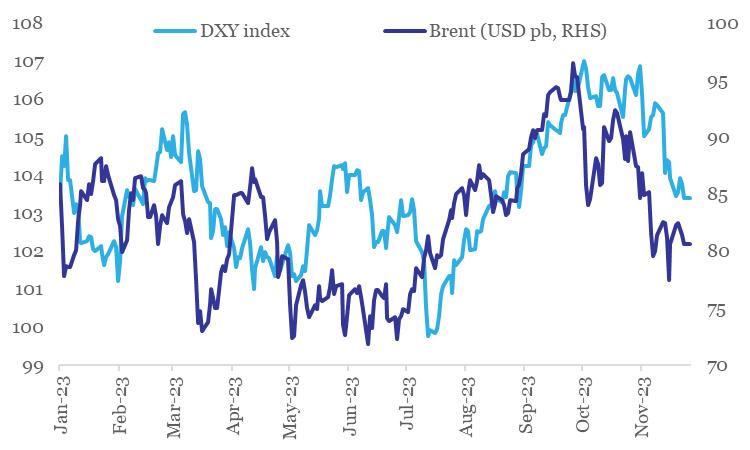
Data: Refinitiv, QuantEco Research
4. CYTD price change in key commodity groups and shipping cost
Note: (i) Price change is between Nov-23 and Dec-22; (ii) Oil price is represented by Brent; (iii) Agriculture Items, Industrial Metals, and Precious Metals are represented by respective Bloomberg Commodity indices; (iv) rounded off figures represented.
Data: Refinitiv, QuantEco Research

Assessing the trade impact from Israel-Palestine conflict, and outlook on Fed rate and rupee
The month of Oct-23 started on a sombre note amidst flaring up of geopolitical conflict. With fast escalation of a war-like situation in Israel and Palestine, global trade (that is still facing lingering disruptions from Russia-Ukraine war, which started in 2022) is bound to witness another jolt. In this newsletter, we assess the potential implications of Israel-Palestine war on India’s trade. This is followed by a quick assessment of US monetary policy along with the outlook on Indian rupee.
1. Trade implications of Israel-Palestine conflict
Over the last ten years, India-Israel merchandise trade has increased from USD 6.1 bn in FY 2013-14 to USD 10.8 bn in FY 2022-23. For the last reported financial year, Israel’s share in India’s merchandise trade stood at 0.9%, with India running a trade surplus of USD 6.1 bn. India is Israel’s 7th largest trade partner globally. Major exports from India to Israel include petroleum products, gems & jewellery, machinery items, etc. Major imports by India from Israel include gems & jewellery, chemicals, machinery items, etc. Potash (used in fertilizers) is a major item of Israel’s exports to India, with India fulfilling a significant share of its requirement from Israel.
- Post Prime Minister Modi’s visit to Israel in Jul-17 (marking the 1st visit by an Indian PM) the relationship was upgraded to a strategic level with seven Agreements/MoUs signed in the fields of technological innovation, water, agriculture, and space.
- Subsequently, Israel’s PM Netanyahu, made a visit to India in Jan-18 during which agreements on cyber security, oil & gas cooperation, film co-production and air transport were signed, along with five other semi-government agreements.
Table 1: India-Israel trade: Key headline numbers
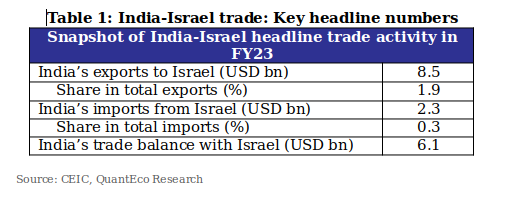
Source: CEIC, QuantEco Research
Table 2: Snapshot of key commodity groups involved in India-Israel trade
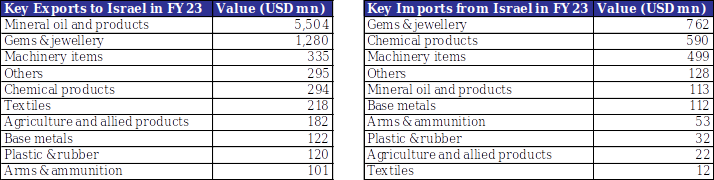
Source: Ministry of Commerce, QuantEco Research
Overall, Israel’s commercial importance for India goes beyond official merchandise trade statistics as: (i) G2G defence trade is not reflected (and Israel happens to be amongst the key suppliers of military equipment to India), and (ii) services trade between the two nations have started to pick-up in areas of cyber security, homeland security, and R&D in high-tech sector.
Meanwhile, merchandise trade between India and Palestine is conducted through Israel and therefore, comprehensive trade statistics are not published by India’s Ministry of Commerce. As per the Palestinian Central Bureau of Statistics, India-Palestine merchandise trade stood at USD 67.8 mn in 2020 (out of which, Indian exports and imports were USD 67.2 mn and USD 0.6 mn, respectively).
As long as the conflict continues only between Israel and Palestine, wider global trade disruptions are likely to be minimal. However, it is important to be vigilant as the situation could potentially turn into a proxy war with involvement of neighbouring countries like Syria and Lebanon, along with some mild unrest in the wider Middle Eastern region. In a worst-case scenario, escalation could turn into a full-fledged war if countries like Iran, Egypt, Jordan, etc. are drawn in – in such a scenario, the unrest in the Middle Eastern region could intensify, with the likelihood of a serious setback to global trade.
Chart 1: Involvement of neighbouring countries in the ongoing Israel-Palestine conflict would be detrimental for the world economy, and India
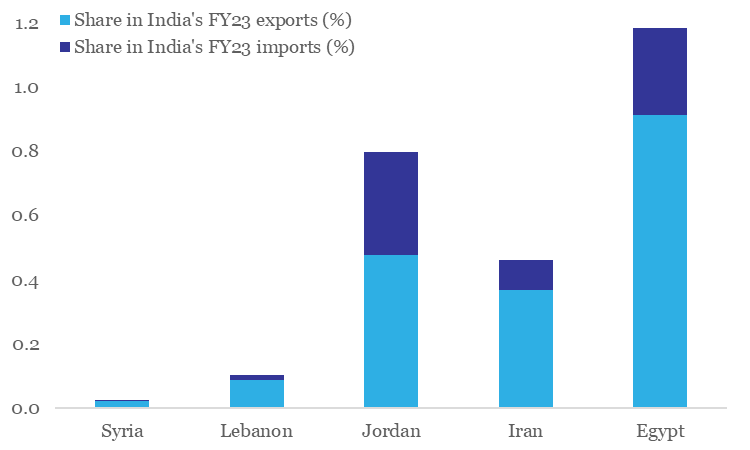
Source: CEIC, QuantEco Research
For India, there could be a double whammy in case of widespread escalation as the spike in geopolitical risk would cause crude oil prices (India sourced ~49% of its petroleum product requirement from the Middle Eastern region in FY 2022-23) to move in tandem, thereby aggravating the growth-inflation balance further. In addition, this could also impact remittance inflow from the Middle East (which accounted for ~29% of total inward remittances in FY 2020-21) and drive portfolio outflows from the country amidst global risk aversion.
Chart 2: Oil could be the prime casualty for India in case Israel-Palestine conflict escalates into a regional war
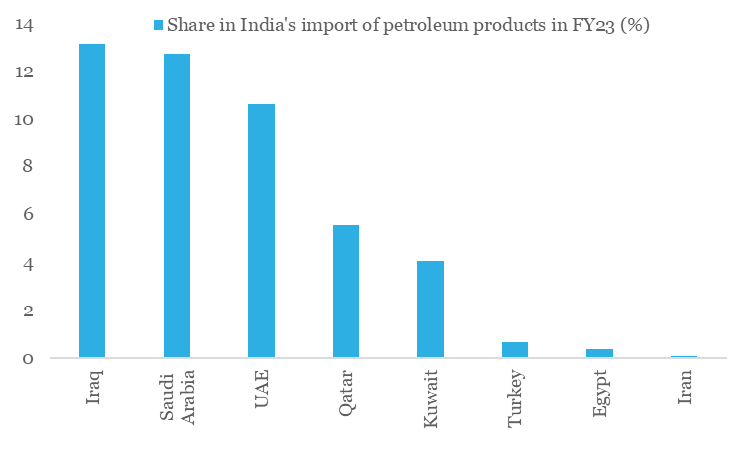
Source: Ministry of Commerce, QuantEco Research
2. Outlook on US monetary policy
Since the Sep 20th Fed policy review meeting, there has been significant upward pressure on US yields. However, the pressure is concentrated at the mid-long tenor bonds, with short dated bonds remaining almost unfazed (between Sep 20th and Oct 20th, while the 10Y UST yield has jumped by 54 bps, 6M UST yield has seen a modest increase of 2 bps). We believe this to be an outcome of the following factors:
- While market participants expect the Fed to be close to the peak of its rate hiking cycle, expectations with respect to aggressive rate cuts in 2024 and 2025 are now being unwound. In other words, US rates could stay at higher levels for longer.
- Fiscal concerns have risen in case of US, resulting in market participants demanding higher yields for longer medium-longer dated bonds.
- Bank of Japan’s partial relaxation of its Yield Curve Control policy is creating a marginal upward pressure on US yields.
Market participants are currently attaching a ~21% probability to a 25 bps rate hike by the Fed by Dec-23. While there is room for one final round of rate hike before 2023 ends (between the two policy reviews scheduled on Nov 1st and Dec 13th), elevated US yields for medium-long tenors could obviate the need for incremental monetary tightening. This is going to be a close call. Going forward, market participants expect the Fed to commence its rate easing cycle from Jun-24 onwards.
Chart 3: Upward pressure on long term yields reflects expectations of rates remaining ‘higher for longer’
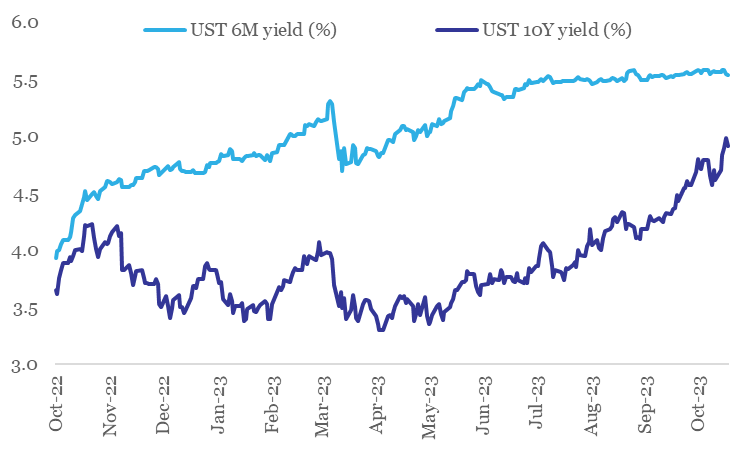
Data: Refinitiv, QuantEco Research
3. Outlining our expected rupee trajectory
Notwithstanding the Indian rupee’s tendency to sporadically flirt with its record low levels in FY 2023-24 so far, the price action continues to be marked by extremely low levels of volatility. In fact, with a 1.2% depreciation on FYTD basis, INR stands out as one of the best performing major currencies (barring Brazilian riyal and Polish zloty).
While India’s relatively strong post COVID economic recovery continues to provide an anchor for INR, there are concerns building up in the near-term.
- US economic resilience has been a positive surprise, which has benefitted the dollar.
- Adverse geopolitical developments have resulted in crude oil price jumping from its recent low of USD 75 bp in May-Jun 2023 to USD 92 pb levels currently.
This makes us believe that the currency is likely to create a fresh low of close to 84 levels against the dollar by Dec-23. If Israel-Palestine conflict remains contained, going forward, we expect the INR to partially reclaim lost ground and move towards 82 levels in Mar-24 amidst favorable Q4 seasonality and anticipated USD weakness as market participants position for a pivot in US monetary policy cycle by mid-2024.
Chart 4: Since Jul-23, dollar and crude have moved against India’s favor
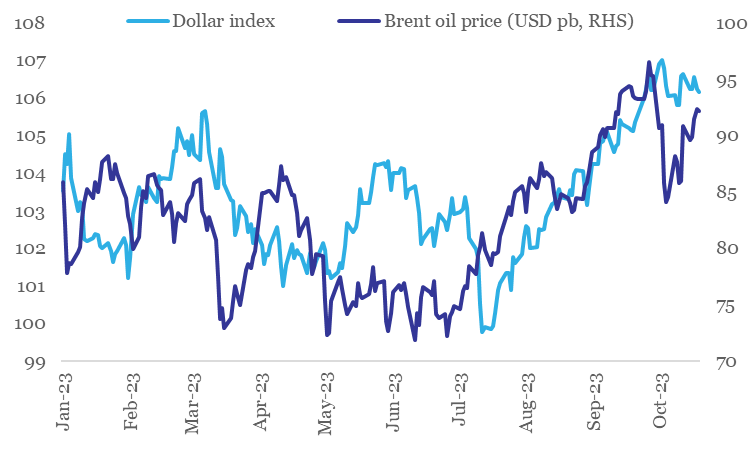
Data: Refinitiv, QuantEco Research
4. CYTD price change in key commodity groups and shipping cost
Note: (i) Price change is between Oct-23 and Dec-22; (ii) Oil price is represented by Brent; (iii) Agriculture Items, Industrial Metals, and Precious Metals are represented by respective Bloomberg Commodity indices.
Data: Refinitiv, QuantEco Research

G20 and trade, widening of India’s trade deficit, and assessment of Fed rate and rupee trajectory
As India concluded a successful G20 Leaders’ Summit in Sep-23, we look at its implications for global trade as well as India. This is followed by taking stock of the change in direction in India’s merchandise trade deficit, followed by a quick assessment of US and India’s monetary policy along with our outlook on rupee.
1. G20 and trade implications
The G20, comprising of 19 countries and the EU, together accounts for 67% of world population, 75% of world trade, and 85% of world GDP. The G20 Trade and Investment Ministers’ Meeting (TIMM) reached consensus on five key areas:
- Digitalization of trade documents: This adoption of non-binding agreement will recognize electronic trade documents as equivalent to paper documents, thereby reducing trade costs and lowering barriers to entry for MSMEs.
- Enhancing access to information for MSMEs: The G20 TIMM adopted ‘Jaipur Call for Action for Enhancing MSMEs’ Access to Information’. This is about using the latest technologies to upgrade the Global Trade Helpdesk, a joint initiative of the ITC (International Trade Centre), the WTO (World Trade Organization) and the UNCTAD (UN Conference on Trade and Development) to provide analytical, user-friendly and easily accessible trade information for MSMEs.
- Generic mapping framework for Global Value Chains (GVCs): The trade ministers endorsed this framework that contains key building blocks of data, analysis, and representation of GVC data. The framework also advocated to identify key dimensions to help evaluate the resilience of GVCs both at the sectoral and product levels.
- Voluntary sharing of best practices on MRAs (Mutual Recognition Agreements) for Professional Services: The compilation of good practices will spur MRAs that will enable recognition of technical qualifications for professional service providers like doctors, nurses, lawyers, architects, etc. by all member countries. It will help Indian professionals in providing their technical services across the world.
- G20 Standards Dialogue: To reduce regulatory divergences and associated trade costs, and monitor trade and investment-related measures, G20 Standards Dialogue in 2023 will be held to bring together members, policymakers, regulators, standard-setting bodies and other stakeholders to discuss topics of common interest such as good regulatory practices and standards.
Besides the G20 New Delhi Declaration (that highlights pertinent trade related aspects above), the Summit also served useful for making progress on trade deals/treaties.
- India has signed an MoU with Saudi Arabia, UAE, European Union, France, Germany, Italy, and the US to establish the India Middle East Europe Economic Corridor (IMEC). This will be a transnational rail and shipping route spread across two continents, which is expected to stimulate economic development through improved connectivity and economic integration between Asia, Arabian Gulf and Europe. For India, this holds immense promise of reducing export related costs to the Middle East and Europe. However, the gains are likely to accrue in the longer term.
- From FTA perspective, progress is currently underway on individual agreements with UK, EU, and Australia. To recall, India & Australia already have Economic Cooperation & Trade Agreement in place, effective December 2022. Among these, the India-UK FTA is expected to go through first.
Meanwhile, India and Canada have “paused” their negotiations on the bilateral FTA on account of ongoing political tensions between the two countries. As per media reports, there is currently no timeline for resuming the India-Canada talks on the Comprehensive Economic Partnership Agreement (CEPA).
Chart 1: G20 partners have ~64% share in India’s merchandise trade
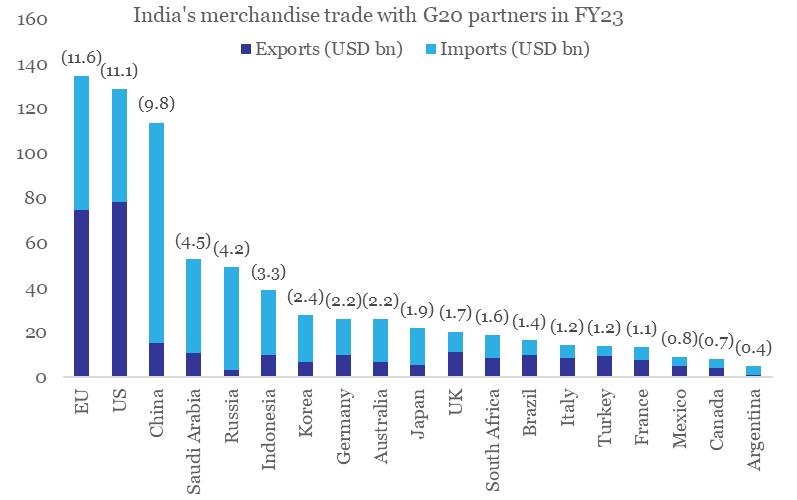
Note: Figures in parenthesis indicate respective % share in India’s total merchandise trade
Data: CEIC, QuantEco Research
Nine items that dominate India’s exports with G20 partners: (i) Mineral fuels and products, (ii) Organic chemicals, (iii) Nuclear reactors, boilers, machinery & appliances, (iv) Electrical machinery, (v) Pharmaceutical products, (vi) Vehicles & parts, (vii) Iron & steel, (viii) Aluminium & articles, and (ix) Misc chemical products.Chart 2: Top commodity exported by India to G20 partners in FY23
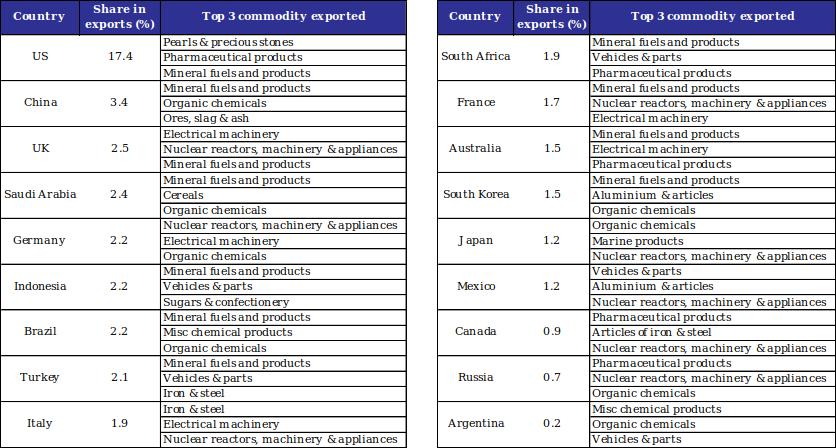
Data: Ministry of Commerce, CEIC, QuantEco Research
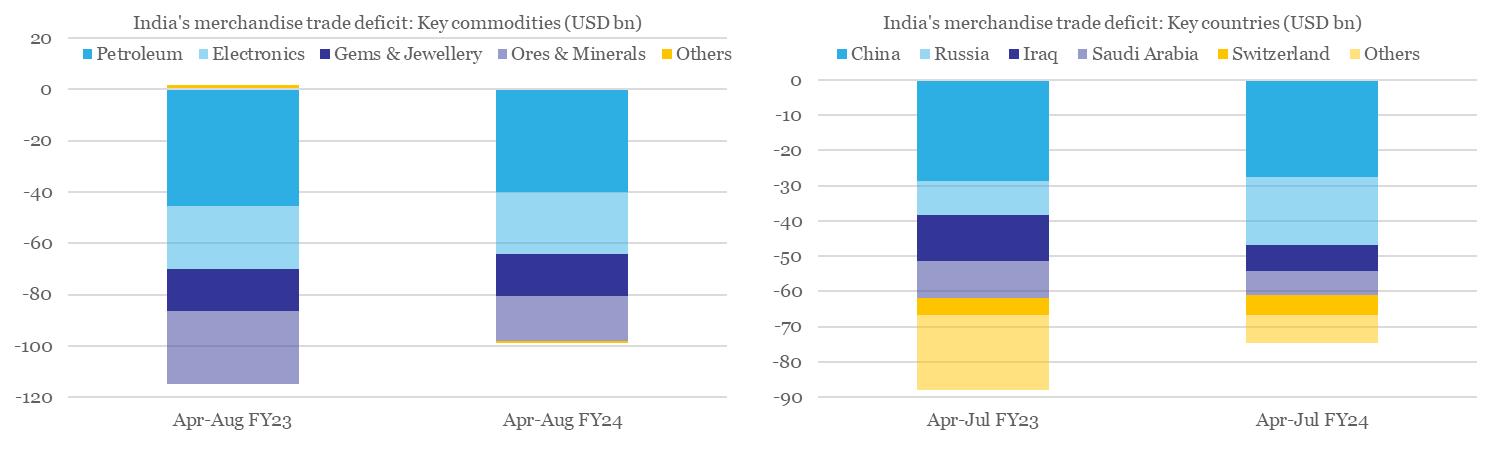
2. India’s monthly merchandise trade deficit is gradually expanding
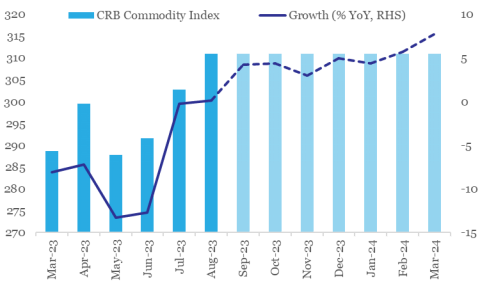
India’s merchandise trade deficit has been gradually expanding and touched a 10-month high of USD 24.2 bn in Aug-23 (up from USD 18.5 bn in Jul-23, while close to USD 24.9 bn in Aug-22). Increase in commodity prices in recent months has been one of the key reasons behind the same – we note that the CRB Commodity Index averaged at 311 in Aug-22 as well as in Aug-23!
- However, on FYTD (Apr-Aug) basis, trade deficit is cumulatively running lower by USD 14 bn. This is largely due to narrowing of the deficit on account of Ores & Minerals and Petroleum Products.
- From country perspective, the cumulative narrowing of FYTD merchandise trade deficit is being driven by Iraq and Saudi Arabia.
Chart 3: Comparison of FYTD performance of India’s merchandise trade deficit
3. Outlook on US monetary policy
Along expected lines, the US Federal Reserve left monetary policy rate unchanged at 5.25-5.50% in its Sep 20th review meet. Interestingly, while the revised dot plot* continues to highlight room for one more round of rate hike in 2023, it now suggests a greater emphasis on interest rates being ‘higher for longer’. As per the Sep-23 dot plot, the FOMC (Federal Open Market Committee) now projects 50 bps rate cut in 2024, lower than the projected 100 bps rate cut as per the previous dot plot of Jun-23.
Market participants are currently attaching a ~31% probability to a rate hike in the next policy review in Nov-23. As of now, market participants expect the Fed to commence its rate easing cycle from Jun-24 onwards, with likelihood of a cumulative 75 bps rate cut before the end of 2024.
Chart 4: Fed is emphasizing on interest rates being ‘higher for longer’
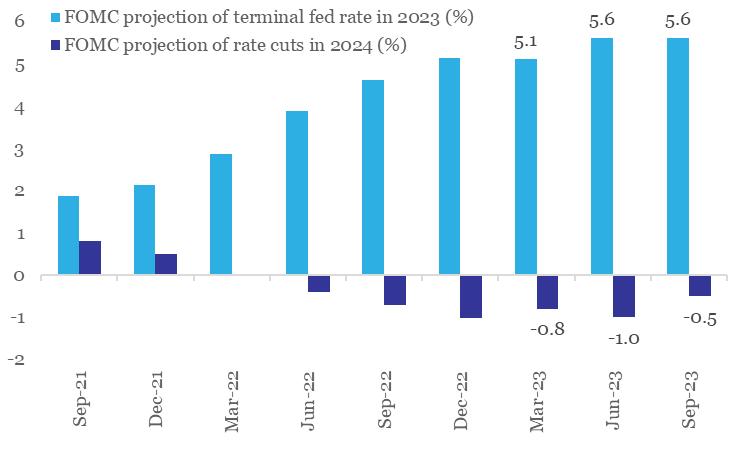
Data: FOMC, QuantEco Research
4. Outlining our expected rupee trajectory
The Indian Rupee weakened to a record low in Sep-23 on the back of a combination of factors:
- Monetary policy divergence between the two largest countries (US poised for one final round of rate hike while China just delivered two rate cuts) is resulting in a stronger USD and a weaker CNY. Both are individually weighing upon INR.
- Recent jump in global commodity prices, esp. crude oil, from an average of USD 75 pb in Jun-23 to USD 92 pb in Sep-23 (so far) would put trade deficit under pressure.
We expect the above-mentioned factors to persist in the near term because of which INR could weaken towards 84 levels within the next 3-months. Going forward, we expect the INR to partially reclaim lost ground and move towards 82 levels amidst favorable Q4 seasonality and anticipated USD weakness as market participants position for a pivot in US monetary policy cycle by mid 2024.
4. Key CYTD changes in price
Note: Price change is between Aug-23 and Dec-22 for respective generic indices
Data: World Bank, Refinitiv, QuantEco Research
Mid-year trade review, Fed’s peak rate, and reassessment of rupee trajectory
Aug-23: Global Trade Check | US Fed Rate & Rupee Outlook | New Infographics on Commodity Trends.
1. Global trade review
Global trade volume registered a contraction of 2.4% YoY in May-23. This marked the sixth annualized contraction in trade volume in seven months. Basis, UNCTAD’s nowcast model, we project global trade volume to see an average contraction of 0.9% in Jul-Sep 2023 quarter, marginally better than the estimated contraction of 1.3% during Apr-Jun 2023 quarter.
Chart 1: Volume of global merchandise trade to remain weak in the near-term
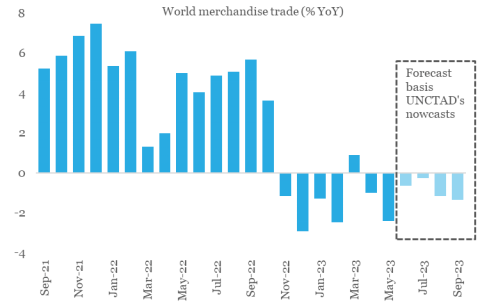
Data: CPB Netherlands, UNCTAD, QuantEco Research
From India’s perspective, we note that key trading partners in developed economies have shown contraction in their import volume in 2023 so far. The forecast of contraction in global trade volume does not augur well for real demand from these economies. Nevertheless, the value of India’s merchandise trade might find some support from firming up of global commodity prices in the last two months.
Chart 2: India’s key export market showing signs of stress
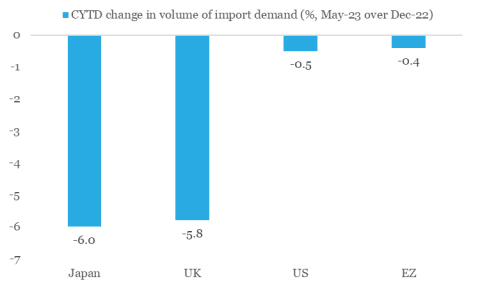
Data: CPB Netherlands, QuantEco Research
Chart 3: Recent pick-up in commodity prices if sustained, will push annualized growth in CRB index to positive territory
Data: Refinitiv, QuantEco Research
The commodity wise run rate for India’s exports shows a divergent behaviour, although the distribution is negatively skewed on a cumulative basis. For e.g., at one end is Electronics Items, which has outperformed others by posting a robust expansion 37.7% YoY (Apr-Jul FY24 over Apr-Jul FY23), while on the other end of the spectrum is Petroleum Products, which is proving to be a drag with 35.7% YoY contraction.
- The spectacular performance of electronic exports derives support from government’s PLI scheme that has helped it to raise its annualized share in India’s merchandise export basket to 6.1% as of Jul-23, up from its pre COVID level of 3.7% (as of Feb-20).
- A sizeable contraction in petroleum exports is primarily reflective of decline in price. India Crude Basket dropped from an average level of USD 109 pb in Apr-Jul FY23 to USD 78 in Apr-Jul FY24, marking a fall of ~28%.
Chart 4: Notwithstanding the sectoral divergence in export performance, the overall skew is negative
Data: Ministry of Commerce, QuantEco Research
2. Outlook on US monetary policy
After raising monetary policy rate range from 0.00-0.25% in Mar-22 to 5.25-5.50% in Jul-23, the US Federal Reserve has delivered a cumulative rate hike of 525 bps in a span of 17-months. That is tantamount to having an average rate hike of 31 bps for 17-consecutive months. Besides other factors, this has contributed towards CPI inflation in US moderating from its peak of 9.1% in Jun-22 to 3.2% in Jul-23. Despite US economy showing signs of some resilience, monetary policy seems to be having the desirable impact (that of curbing inflation), albeit with a lag. As per last FOMC (Federal Open Market Committee) in Jun-23, the Fed members projected the median fed funds target range at 5.50-5.75% before the end of 2023. This implies scope for one more rate hike before the Fed reaches its interest rate peak in the current cycle.
Market participants are currently attaching a ~31% probability to a rate hike by Nov-23, followed by a pause until Mar-24. As of now, market participants expect the Fed to commence its rate easing cycle from May-24 onwards, with likelihood of a cumulative 100 bps rate cut before the end of 2024. This is in line with the FOMC projections made in Jun-23.
3. Outlining our expected rupee trajectory
The Indian Rupee weakened to a record low in Aug-23 on the back of a combination of factors:
- Monetary policy divergence between the two largest countries (US poised for one final round of rate hike while China just delivered two rate cuts) is resulting in a stronger USD and a weaker CNY. Both individually are responsible for weighing upon INR.
- Recent jump in global commodity prices, esp. crude oil, from an average of USD 75 pb in Jun-23 to USD 87 pb in Aug-23 (so far) would widen the trade deficit.
We expect the above-mentioned factors to persist in the near term because of which INR could weaken towards 84 levels within the next 3-months. Going forward, we expect the INR to partially reclaim lost ground and move towards 82 levels amidst favorable Q4 seasonality and anticipated USD weakness as market participants position for a pivot in US monetary policy cycle later in the year.
Chart 5: Adverse Q2 seasonality is catching up with rupee
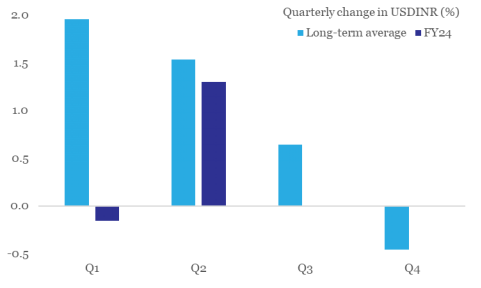
(Data: Refinitiv, QuantEco Research)
4. Key CYTD changes in price

Note: Price change is between Jul-23 and Dec-22 for respective generic indices
( Data: World Bank, Refinitiv, QuantEco Research)
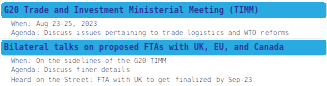
5. Key events worth tracking
One year of war, record weakness in export financing, and reassessment of Fed rate trajectory
The Russia-Ukraine war has completed one year with no signs of resolution in the near term. In this newsletter, we take a look at winners and losers from the perspective of India’s merchandise exports at destination as well as commodity level in the last 12-months dominated by disruptions on account of the war. We round it up with an update on export credit performance along with our customary commentary on INR.
1. Winners and losers from Russia-Ukraine war
At headline level, India’s merchandise exports moderated from USD 37.2 bn in Feb-22 to USD 32.9 bn in Jan-23 (while the slowdown cannot be completely attributed to the Russia-Ukraine war, the disruptions from it aggravated the global inflation scenario, which in turn attracted aggressive monetary tightening from most central banks, thereby impacting external demand).
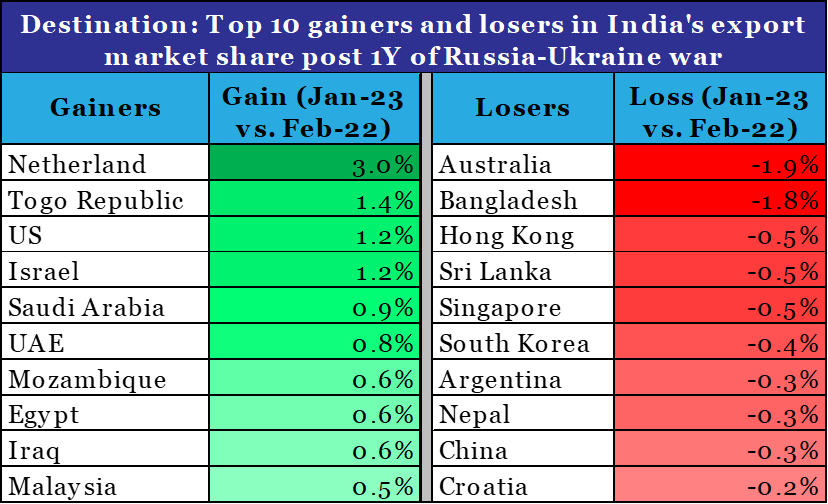
From destination perspective:
- Netherland emerged as the top gainer, with its share in India’s export basket jumping from 3.9% in Feb-22 to 6.9% in Jan-23
- Australia emerged as the top loser, with its share in India’s export basket declining from 3.1% in Feb-22 to 1.2% in Jan-23
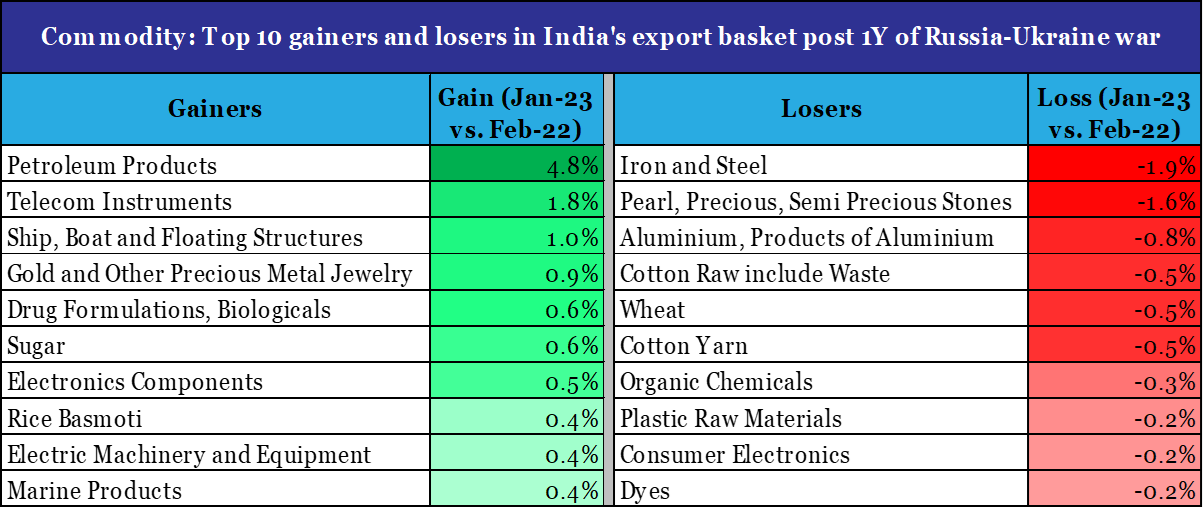
From commodity perspective:
- Petroleum Products became the top gainer, with its share in India’s export basket jumping from 18.6% in Feb-22 to 23.3% in Jan-23
- Iron & Steel became the top loser, with its share in India’s export basket declining from 4.7% in Feb-22 to 2.9% in Jan-23
Data: Ministry of Commerce, QuantEco Research
Data: Ministry of Commerce, QuantEco Research
Although global value chain disruptions have eased compared to one year ago levels, the nature of disruption from the war could continue to have a similar impact on destination and commodity wise performance of India’s exports. We can expect the top beneficiaries and losers to by and large remain unchanged at least in the near term.
2. Weakness persists in export financing
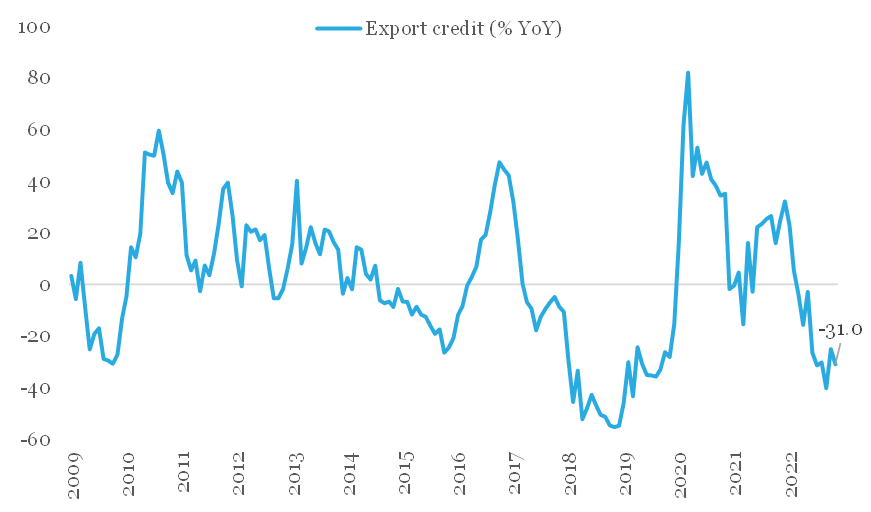
Amidst slowdown in India’s exports, export financing continues to maintain its declining trend. On annualized basis, export credit has been in contraction since Mar-22, with Jan-23 print of -41.4% being the lowest in nearly 4-years. The overall value of outstanding export credit from banks has fallen to Rs 14,390 cr in Jan-23 from Rs 23,681 cr in Mar-22.
The ratio of export credit to value of merchandise exports (a proxy for extent of export financing coverage) is currently at its lowest levels around 5.0%. As per media reports, with demand uncertainty persisting, exporters are either delaying shipment orders or are not extending the terms of the contract.
Export finance contracting amidst uncertainty
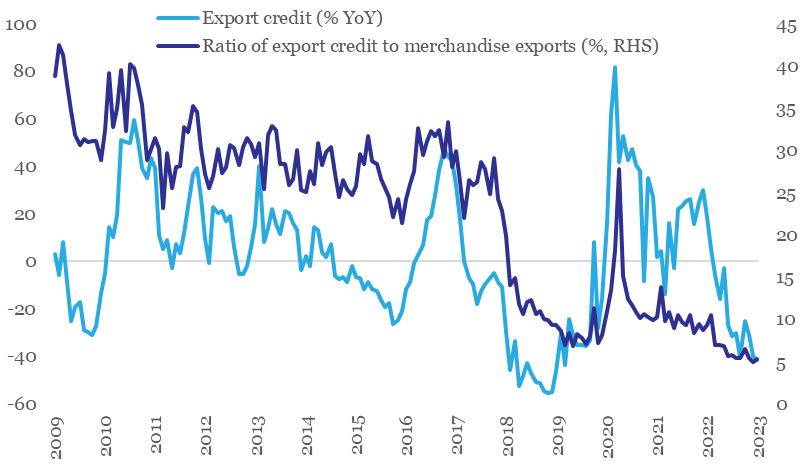
Data: RBI, QuantEco Research
INR: Reassessment of Fed rate trajectory supporting dollar
The Indian Rupee depreciated by 0.9% in Feb-23. This was predominantly a reflection of underlying strong recovery of the US Dollar. The dollar index gained sharply by 2.7% in Feb-23 as market participants priced in additional 75 bps rate hike from the US Fed (vs. 25-50 bps earlier) on account of recent strong economic data in US coupled with firm inflation numbers. Noticeably, market participants have now priced out rate cuts from last quarter of 2023 (vs. expectation of 25-50 bps rate cut earlier).
We had highlighted our USDINR call of 83.5 levels by Mar-23 in previous editions of Credlix Finsights. We continue to maintain the same and expect USDINR to further move higher towards 85.5 levels by Mar-24 on likelihood of persistence of deficit in India’s Balance of Payments.
INR is moving in tandem with USD in 2023 so far
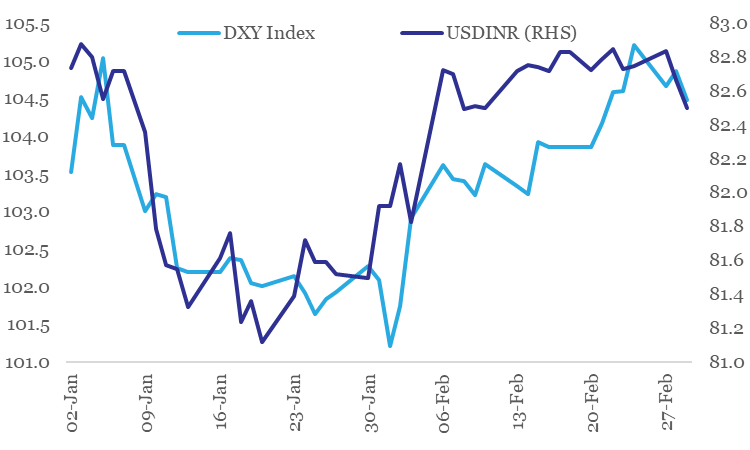
Data: Refinitiv, QuantEco Research
Website: https://www.quanteco.in/

Update on global economy, India Budget highlights and US monetary policy
The week gone by saw two major economic events relevant for India along with a key economic forecast update for the global economy
1. Taking stock of global economic forecasts
The International Monetary Fund in its quarterly review of the global economy presented few notable changes in its key economic forecasts.
- While World GDP growth forecast for 2023 got revised up, projection for the incremental loss of momentum compared to 2022 remains unchanged at 50 bps. The mark-up predominantly reflects the re-opening impact of the Chinese economy.
- Recovery expectation for 2024 remains intact; although it is likely to be mild, with World GDP growth forecasted to be lower vs. the long term (2000-19) average of 3.8%.
- Forecast for volume of world trade (goods + services) saw a downward revision for both 2023 and 2024, although 2024 continues to depict a moderate recovery in global trade volumes.
IMF’s key global economic forecasts (%, as of Jan-23)
| 2022 Estimate | 2023 Forecast | 2024 Forecast | |
| World GDP | 3.4 (+0.2) | 2.9 (+0.2) | 3.1 (-0.1) |
| US | 2.0 (+0.4) | 1.4 (+0.4) | 1.0 (-0.2) |
| Eurozone | 3.5 (+0.4) | 0.7 (+0.2) | 1.6 (-0.2) |
| UK | 4.1 (+0.5) | -0.6 (-0.9) | 0.9 (+0.3) |
| China | 3.0 (-0.2) | 5.2 (+0.8) | 4.5 (no change) |
| India | 6.8 (no change) | 6.1 (no change) | 6.8 (no change) |
| World Trade Volume (Goods + Services) | 5.4 (+1.1) | 2.4 (-0.1) | 3.4 (-0.3) |
Data: IMF, QuantEco Research
In the near term, the massive earthquake in Turkey (besides its humanitarian impact) is likely to have a mild impact on India’s exports, which stood at USD 10.0 bn in 2022 (2.2% in India’s export basket). As per the Global Trade Research Initiative, suspension of one of the two main container ports is Turkey will delay shipments and could potentially take about a month to normalize its activity. It is likely that discretionary items like Yarns, Dyes, and Gems & Jewellery could see negative export growth in Feb-Mar 2023.
2. Key takeaways from the 2023-24 Union Budget
- Target for fiscal deficit was lowered to 5.9% of GDP from 6.4% in 2022-23.
- While the Budget refrained from any big bang policy announcements, quality of spending got a significant boost with hike in allocation for capital expenditure to a two decade high of 3.3% of GDP from 2.7% in 2022-23. Bulk of the capex in 2023-24 would be driven by railways, roads, defence, telecom, petroleum, and housing & urban development.
- From exports perspective, the Budget hiked allocation for some key schemes like the Remission of Duties and Taxes on Export Products (up 10.0% to Rs 15069 cr), Rebate of State and Central Taxes and Levies (up 12.7% to Rs 8405 cr), and Interest Equalisation Scheme (up 23.4% to Rs 2932 cr). This is expected to help improve cost efficiency for SME exporters.
- Targeted reduction in import duty for specific products will build on
addto the competitiveness of exports of chemical products, marine products, gems & jewellery, and electronic items. In addition, the Budget increased the allocation for the PLI (Performance Linked Incentives) Scheme by 67.7% to Rs 8,083 cr, with bulk of the increase earmarked for electronics & hardware, food processing, automobiles, and pharmaceuticals sector.
3. US central bank normalizes rate hikes
The US Federal reserve announced a 25 bps rate hike on Feb 1st , taking the fed funds rate range to 4.50-4.75%, taking cumulative tightening done since 2022 to 450 bps. Market participants expect one further round of 25 bps rate hike in Mar-23 before the Fed gets into a pause.
The downshift in Fed’s monetary policy aggression will reduce the pressure on other central banks. As expected, the RBI has also stepped down in magnitude of rate hike to 25 bps in Feb-23 from 35 bps in Dec-22. Going forward, we expect the RBI to announce its last rate hike of 25 bps in Apr-23, after which it could get into a pause mode for impact assessment.delivered its final 25 bps rate hike in the current tightening cycle on Feb 8th, after which it is expected to maintain an extended pause.
INR: Starts 2023 on a positive note, but mild depreciation bias to persist
The Indian Rupee appreciated by 1.0% in the month of Jan-23, which was predominantly a reflection of underlying weakness in the US Dollar. Expectation of rate hike cycle ending earlier in US vis-à-vis its key peers is weighing upon the dollar. While this could provide some near-term appreciation pressure on INR, we believe the RBI would use this opportunity to rebuild FX reserves (by purchasing USD) and thereby limit INR appreciation. We continue to expect USDINR to trade close to 83.5 levels by Mar-23, and towards 85.5 levels by Mar-24 on likelihood of persistence in India’s Balance of Payments Deficit.
India’s FX reserves have increased for four consecutive months
Note: Data is for end of month; for Jan 2023, it is for week ending 27th. Change in reserves can be on account of actual purchase/sale of dollars and gold by the RBI along with revaluation impact.
Data: RBI, QuantEco Research
* BoP deficit for 2022-23 is our forecast. Change in USDINR in 2022-23 is as of Jan 17th.
What should Exporters Do ?
- Be cautious on Buyer Credit risk and mitigate 100% of the exposure using Export Factoring or Credit Insurance (ECGC, private) for all of their exports. 2023 still seems quite a volatile year and not the time to take any form of risk on Buyers (for open account business).
- There is expectation that this year sizable demand from US/EU that was catered by China will move to India (China + 1) especially across Synthetic Apparels, Pharma, Metal fabricated products, handicrafts, toys, leather products, etc. This can be a good opportunity to build scale for Indian exporters.
Website: https://www.quanteco.in/
Export assessment survey, export credit, and Budget expectations
As 2023 commences, we take this opportunity to look beyond usual export statistics and evaluate how the enabling environment appears from the perspective of sentiment, finance, and expectations from the upcoming Union Budget 2023-24.
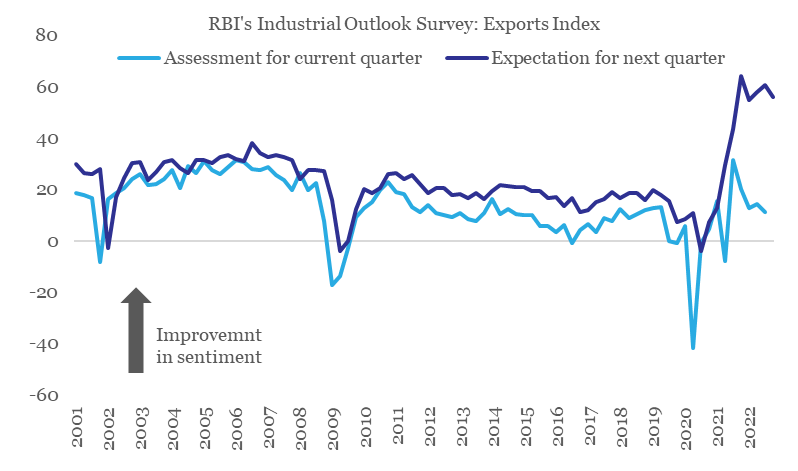
1. Export sentiment
As per RBI’s Industrial Outlook Survey, the index for exports (capturing current assessment and expectations) has been on a declining trend after peaking out in Q2-Q3 of 2021-22. This trend in survey-based sentiment indicators for exports appears to be confirming the slowdown in external demand.
Export sentiment on a declining trend
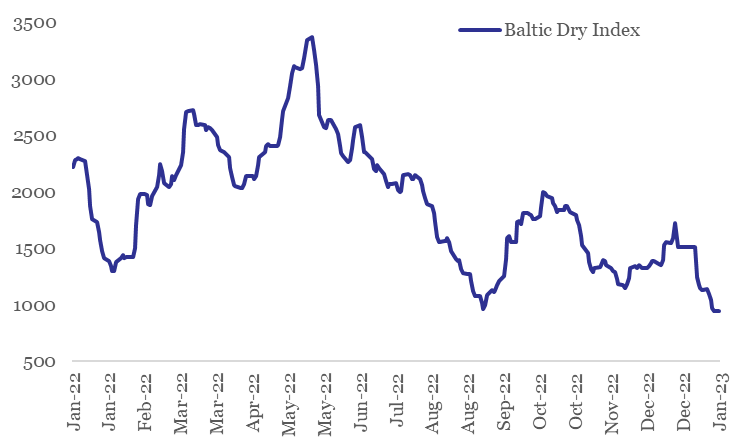
From near term perspective, the sharp slide in Baltic Dry Index1 (-37.6% in Jan-23 so far) is concerning and points towards tepid global trade. However, the impact currently is likely to be exaggerated on account of Chinese New Year holiday and the upcoming monsoon season in Brazil. In fact, with easing of COVID restrictions and re-opening of Chinese economy, global trade could see a spurt in near term momentum (post the commencement of the extended holiday season).
Sharp slide in Baltic Dry Index in Jan-23
2. Export financing
Amidst slowdown in India’s exports, export financing has also seen a sharp decline – on annualized basis, export credit has been in contraction since Mar-22. The overall value of outstanding export credit from banks has fallen to Rs 15,506 cr in Nov-22 from Rs 23,621 cr in Mar-22. As per media reports, with demand uncertainty persisting, exporters are either delaying shipment orders or are not extending the terms of the contract.
Export credit has contracted for nine consecutive months
3. Expectations from the 2023-24 Union Budget
Amidst headwinds from slowing demand and rising cost burden, the government could be considering raising interest equalization or subsidy benefits (by up to 2%) extended to MSME exporters. This is likely to benefit exporters from labour-intensive sectors like ready-made garments, toys, handicrafts, auto components, and processed food. In addition, the government could also be considering laying incentives for setting up of domestic Testing & Certification centres for MSME exporters and expansion of TReDS (Trade Receivables Discounting System) services to cover larger number of MSMEs and PSUs/ Corporates.
INR: Under BoP2 pressure
India’s net balance of payment (BoP) registered a deficit of 3.7% of GDP in Jul-Sep quarter of 2022-23 – this was the widest deficit since the 2008 Global Financial Crisis. Wide trade/ current account deficit and insufficient capital flows to fund them were the key underlying reasons for the same.
A BoP deficit reflects greater demand for dollars, and hence pressure on rupee. As such, INR weakened by 3.0% during Jul-Sep quarter of 2022-23 (moving from 78.97 in Jun-22 to 81.34 in Sep-22) despite heavy intervention by the RBI. With INR weakening by a further 1.7% in Oct-Dec quarter of 2022-23, we expect BoP deficit to have persisted, albeit at a moderate level.
While this would reduce the pressure on INR, bias for mild weakness is nevertheless likely to persist. As such, we expect USDINR to trade close to 83.5 levels by Mar-23, and towards 85.5 levels by Mar-24.
BoP deficits have always caused depreciation in INR
| Year | Size of BoP Deficit (% of GDP) | Change in USDINR (%) |
| 1995-96 | -0.3 | 8.0 |
| 2008-09 | -1.8 | 26.3 |
| 2011-12 | -0.8 | 14.3 |
| 2018-19 | -0.1 | 6.3 |
| 2022-23* | -1.1 | 7.9 |
* BoP deficit for 2022-23 is our forecast. Change in USDINR in 2022-23 is as of Jan 17th.
What should the Exporters Do ?
- Be watchful of Buyer credit worthiness given the heightened uncertainty and volatility expected during the next 12 months across interest rates, commodity prices and weakening demand in Buyer Countries.
- Diversification of Buyer Geographies is the dominant theme: Middle East esp. Saudi Arabia, UAE etc. seem to be performing quite well. South East Asia overall seems to be impacted far lesser as compared to western economies.
- Avail Factoring or Credit Insurance (private or Govt. ECGC) without fail on all exports.
Footnotes:
1. The Baltic Dry Index is a comprehensive measure of cargo rates for capesize, panamax and supramax shipping vessels carrying dry bulk commodities.
2. Balance of Payments (BoP) is the net dollar flow position into the country on account of current account (trade, repatriation, interest & dividend income) and capital account transactions (foreign investments, external commercial borrowings, banking capital, etc.).
Website: https://www.quanteco.in/

Who moved my exports and exchange rate?
As per the World Trade Organization, growth in global merchandise trade volume is expected to slip to 1.0% in 2023 (slowest since the initial COVID outbreak in 2020) from 3.5% in 2022.
Who is pulling down India’s exports?
The global merchandise trade environment is looking sombre due to multiple shocks:
- US: Aggressive monetary policy tightening would hit interest-sensitive spending in areas such as housing, motor vehicles and fixed investment.
- Europe: High energy prices stemming from the Russia-Ukraine war will raise manufacturing costs and squeeze household spending.
- China: Slowdown in real estate sector and COVID related uncertainty is weighing upon supply chains.
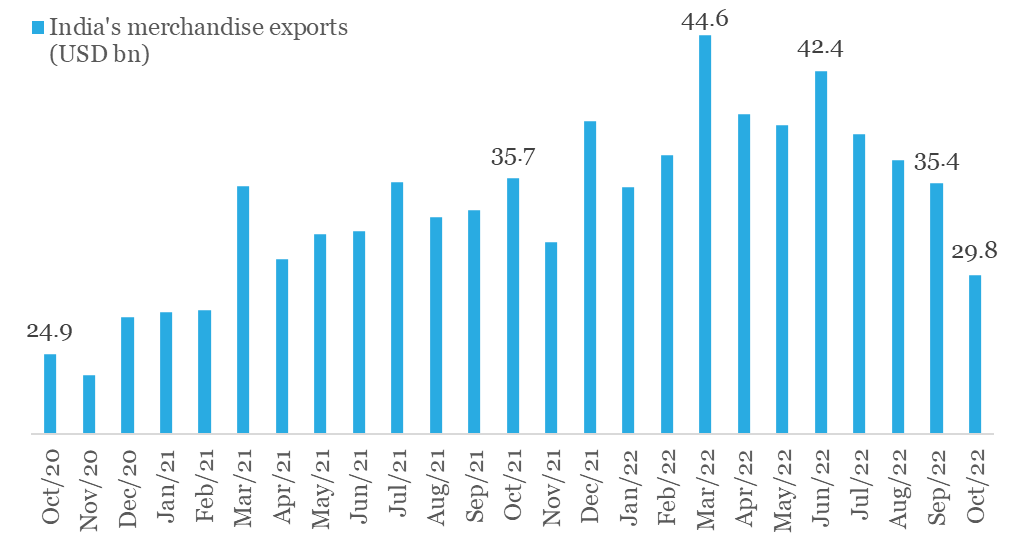
For India, the second half of FY23 started on a cautious note as far as external trade is concerned. While both exports and imports have eased from their respective monthly peaks, the slowdown in exports is concerning.
- From its monthly peak of USD 42.4 bn in Jun-22, exports are down by ~30% to USD 29.8 bn in Oct-22
- For the first time in 20-months, monthly exports fell below USD 30 bn in Oct-22
- Exports posted their first annualized contraction (-16.7% YoY) in last 20-months
India’s exports have been easing since its FY23 monthly peak in June
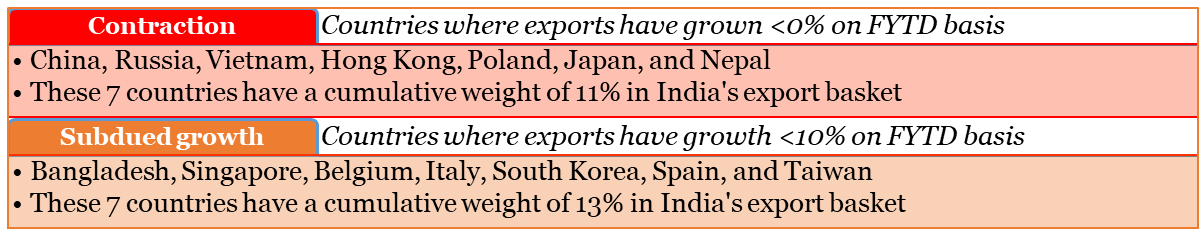
Focusing on key countries (having more than 0.5% share in India’s exports), we find that drag on India’s exports in FY23 so far is coming from:
FX commentary
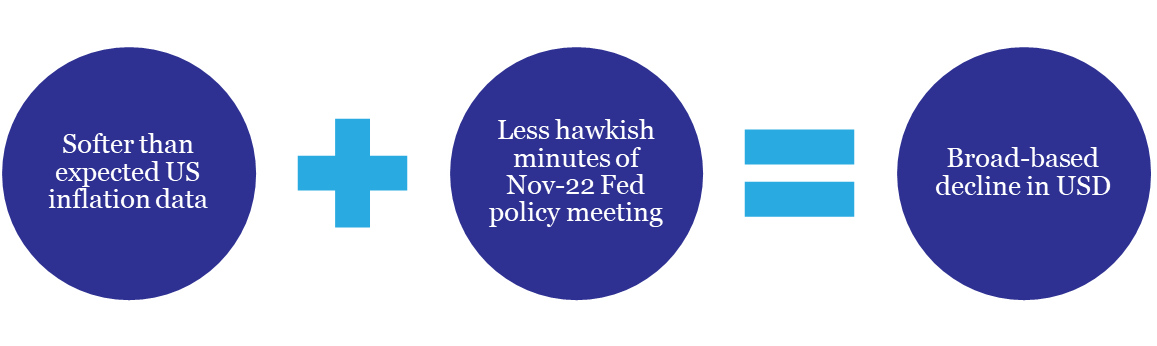
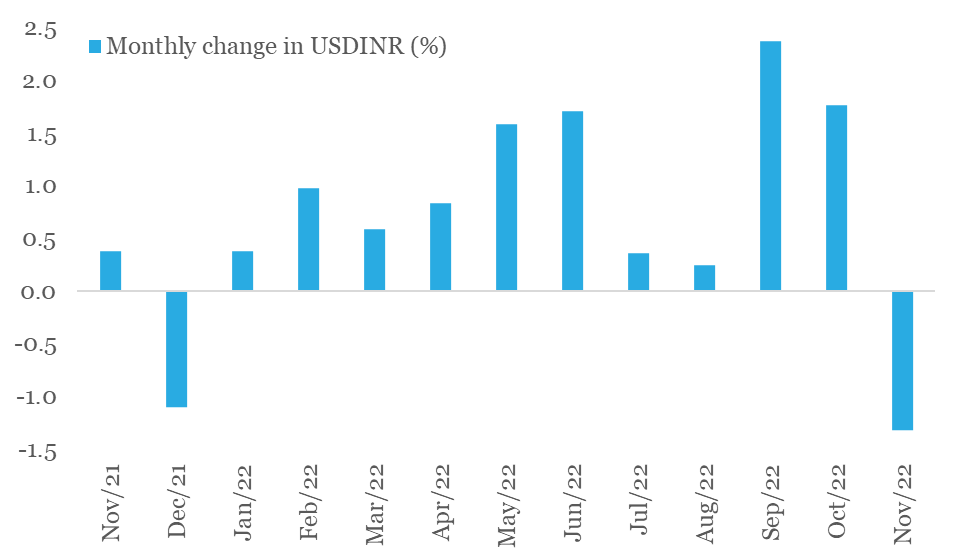
With Nov-22 drawing to an end, we cannot help but notice the first monthly appreciation in Indian rupee after a gap of 11-months. This happened on the back of a broad-based decline in the US dollar (the DXY Index has fallen by 5.1% in Nov-22 so far, making it the worst monthly loss for the dollar in over 12-years).
While the down move in DXY index has been swift, we are not convinced of its durability yet:
- Although market participants now anticipate the Fed to prune its aggression by dialing down the pace of rate hike to 50 bps in the next couple of meetings from 75 bps in last four policy meets, expectations with respect to the terminal fed funds rate (i.e., peak monetary policy rate in the current cycle) have moved up to 5.00-5.25% from 4.50-4.75% earlier (as per the last median forecast provided by the Fed in Sep-22).
- Going into 2023, the Fed will reduce its balance sheet by a further USD 1.1tn, way ahead of any other major central bank. This mop up of global dollar liquidity would continue to support the USD.
- Build-up of relatively higher recessionary risks in Europe and elevated geopolitical risk premium could sporadically boost safe haven appeal of the USD.
As such, we expect residual pressure on rupee to persist, albeit to a mild degree. Our fundamental view on USDINR is guided by our call of USD 130 bn deficit on India’s current account deficit in FY23, accompanied by USD 50 bn deficit on Balance of Payments (i.e., current account deficit adjusted for total net capital inflows).
INR poised for its first monthly gain in 2022
Website: https://www.quanteco.in/
