
The month of Oct-23 started on a sombre note amidst flaring up of geopolitical conflict. With fast escalation of a war-like situation in Israel and Palestine, global trade (that is still facing lingering disruptions from Russia-Ukraine war, which started in 2022) is bound to witness another jolt. In this newsletter, we assess the potential implications of Israel-Palestine war on India’s trade. This is followed by a quick assessment of US monetary policy along with the outlook on Indian rupee.
1. Trade implications of Israel-Palestine conflict
Over the last ten years, India-Israel merchandise trade has increased from USD 6.1 bn in FY 2013-14 to USD 10.8 bn in FY 2022-23. For the last reported financial year, Israel’s share in India’s merchandise trade stood at 0.9%, with India running a trade surplus of USD 6.1 bn. India is Israel’s 7th largest trade partner globally. Major exports from India to Israel include petroleum products, gems & jewellery, machinery items, etc. Major imports by India from Israel include gems & jewellery, chemicals, machinery items, etc. Potash (used in fertilizers) is a major item of Israel’s exports to India, with India fulfilling a significant share of its requirement from Israel.
- Post Prime Minister Modi’s visit to Israel in Jul-17 (marking the 1st visit by an Indian PM) the relationship was upgraded to a strategic level with seven Agreements/MoUs signed in the fields of technological innovation, water, agriculture, and space.
- Subsequently, Israel’s PM Netanyahu, made a visit to India in Jan-18 during which agreements on cyber security, oil & gas cooperation, film co-production and air transport were signed, along with five other semi-government agreements.
Table 1: India-Israel trade: Key headline numbers
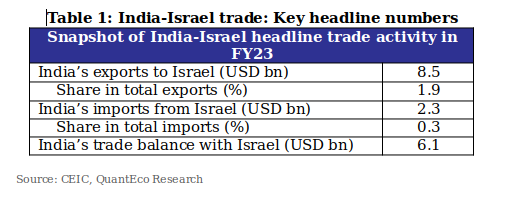
Source: CEIC, QuantEco Research
Table 2: Snapshot of key commodity groups involved in India-Israel trade
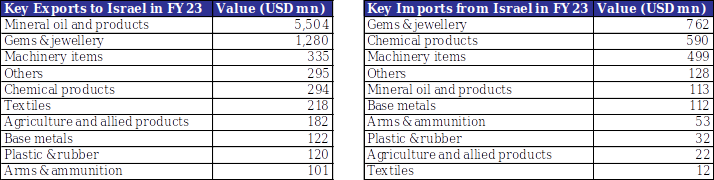
Source: Ministry of Commerce, QuantEco Research
Overall, Israel’s commercial importance for India goes beyond official merchandise trade statistics as: (i) G2G defence trade is not reflected (and Israel happens to be amongst the key suppliers of military equipment to India), and (ii) services trade between the two nations have started to pick-up in areas of cyber security, homeland security, and R&D in high-tech sector.
Meanwhile, merchandise trade between India and Palestine is conducted through Israel and therefore, comprehensive trade statistics are not published by India’s Ministry of Commerce. As per the Palestinian Central Bureau of Statistics, India-Palestine merchandise trade stood at USD 67.8 mn in 2020 (out of which, Indian exports and imports were USD 67.2 mn and USD 0.6 mn, respectively).
As long as the conflict continues only between Israel and Palestine, wider global trade disruptions are likely to be minimal. However, it is important to be vigilant as the situation could potentially turn into a proxy war with involvement of neighbouring countries like Syria and Lebanon, along with some mild unrest in the wider Middle Eastern region. In a worst-case scenario, escalation could turn into a full-fledged war if countries like Iran, Egypt, Jordan, etc. are drawn in – in such a scenario, the unrest in the Middle Eastern region could intensify, with the likelihood of a serious setback to global trade.
Chart 1: Involvement of neighbouring countries in the ongoing Israel-Palestine conflict would be detrimental for the world economy, and India
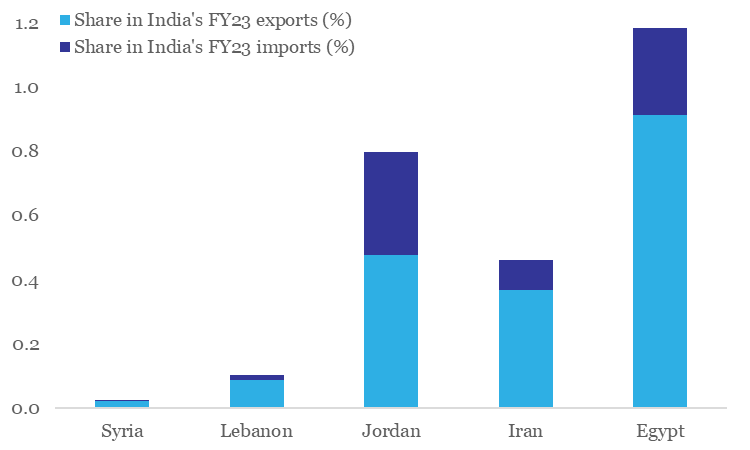
Source: CEIC, QuantEco Research
For India, there could be a double whammy in case of widespread escalation as the spike in geopolitical risk would cause crude oil prices (India sourced ~49% of its petroleum product requirement from the Middle Eastern region in FY 2022-23) to move in tandem, thereby aggravating the growth-inflation balance further. In addition, this could also impact remittance inflow from the Middle East (which accounted for ~29% of total inward remittances in FY 2020-21) and drive portfolio outflows from the country amidst global risk aversion.
Chart 2: Oil could be the prime casualty for India in case Israel-Palestine conflict escalates into a regional war
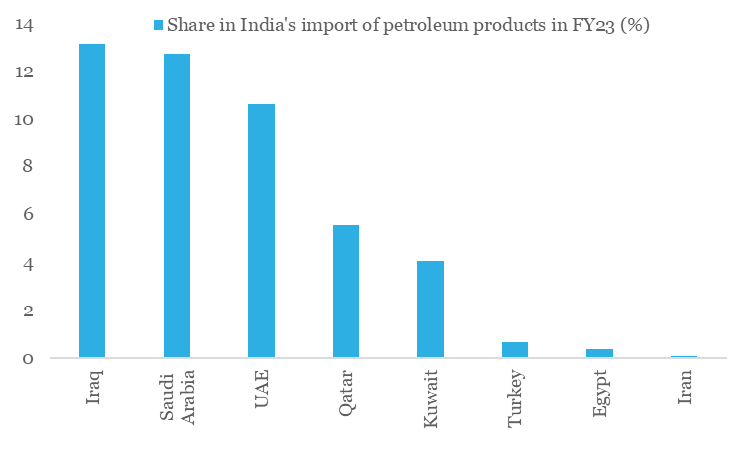
Source: Ministry of Commerce, QuantEco Research
2. Outlook on US monetary policy
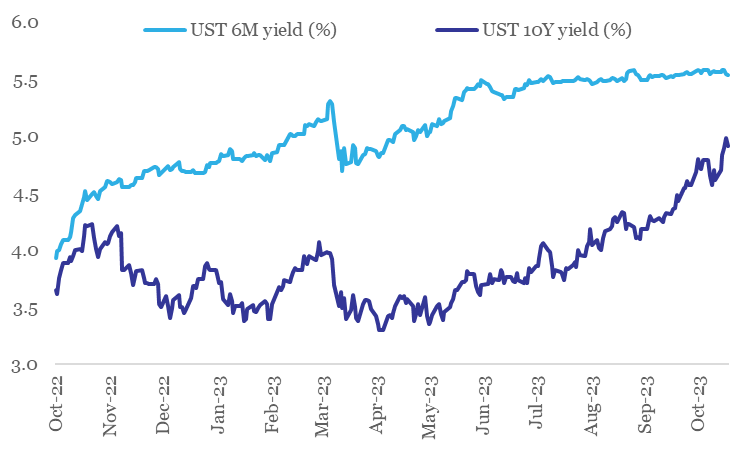
Since the Sep 20th Fed policy review meeting, there has been significant upward pressure on US yields. However, the pressure is concentrated at the mid-long tenor bonds, with short dated bonds remaining almost unfazed (between Sep 20th and Oct 20th, while the 10Y UST yield has jumped by 54 bps, 6M UST yield has seen a modest increase of 2 bps). We believe this to be an outcome of the following factors:
- While market participants expect the Fed to be close to the peak of its rate hiking cycle, expectations with respect to aggressive rate cuts in 2024 and 2025 are now being unwound. In other words, US rates could stay at higher levels for longer.
- Fiscal concerns have risen in case of US, resulting in market participants demanding higher yields for longer medium-longer dated bonds.
- Bank of Japan’s partial relaxation of its Yield Curve Control policy is creating a marginal upward pressure on US yields.
Market participants are currently attaching a ~21% probability to a 25 bps rate hike by the Fed by Dec-23. While there is room for one final round of rate hike before 2023 ends (between the two policy reviews scheduled on Nov 1st and Dec 13th), elevated US yields for medium-long tenors could obviate the need for incremental monetary tightening. This is going to be a close call. Going forward, market participants expect the Fed to commence its rate easing cycle from Jun-24 onwards.
Chart 3: Upward pressure on long term yields reflects expectations of rates remaining ‘higher for longer’
Data: Refinitiv, QuantEco Research
3. Outlining our expected rupee trajectory
Notwithstanding the Indian rupee’s tendency to sporadically flirt with its record low levels in FY 2023-24 so far, the price action continues to be marked by extremely low levels of volatility. In fact, with a 1.2% depreciation on FYTD basis, INR stands out as one of the best performing major currencies (barring Brazilian riyal and Polish zloty).
While India’s relatively strong post COVID economic recovery continues to provide an anchor for INR, there are concerns building up in the near-term.
- US economic resilience has been a positive surprise, which has benefitted the dollar.
- Adverse geopolitical developments have resulted in crude oil price jumping from its recent low of USD 75 bp in May-Jun 2023 to USD 92 pb levels currently.
This makes us believe that the currency is likely to create a fresh low of close to 84 levels against the dollar by Dec-23. If Israel-Palestine conflict remains contained, going forward, we expect the INR to partially reclaim lost ground and move towards 82 levels in Mar-24 amidst favorable Q4 seasonality and anticipated USD weakness as market participants position for a pivot in US monetary policy cycle by mid-2024.
Chart 4: Since Jul-23, dollar and crude have moved against India’s favor
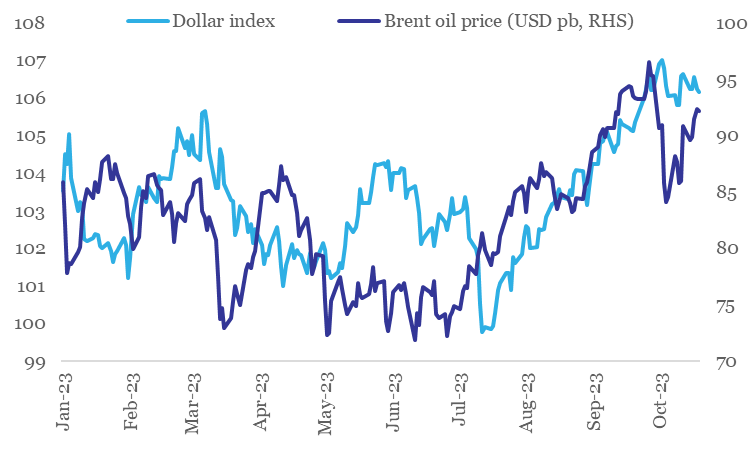
Data: Refinitiv, QuantEco Research
4. CYTD price change in key commodity groups and shipping cost

Note: (i) Price change is between Oct-23 and Dec-22; (ii) Oil price is represented by Brent; (iii) Agriculture Items, Industrial Metals, and Precious Metals are represented by respective Bloomberg Commodity indices.
Data: Refinitiv, QuantEco Research
