With the Israel-Hamas war continuing to simmer in the backdrop, global trade is now confronting fresh concerns in the Red Sea trade route. We take a cursory look at these developments to assess the potential on India’s merchandise trade, esp. exports. This is followed by a quick assessment of US monetary policy along with the outlook on Indian rupee.
1. Can the Red Sea disturbance lead to trade distress?
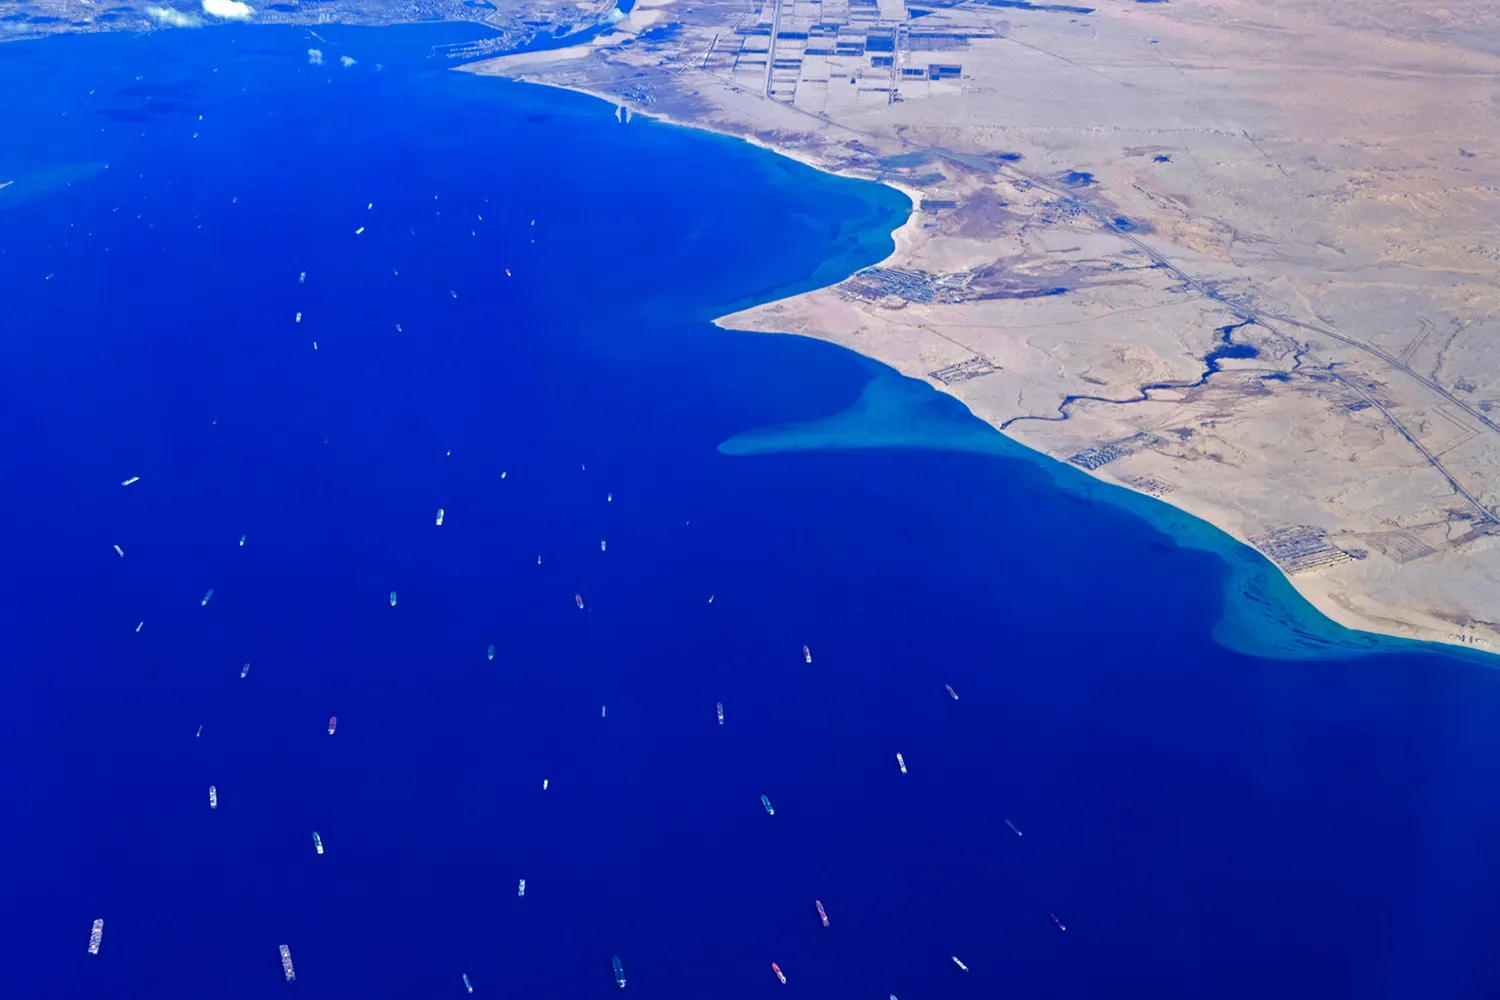
Global supply chains have started facing disruption as maritime activity in the Red Sea region has dropped significantly following attacks by Houthis (a Yemen based rebel group, which is known to be backed by Iran, has declared its support for Hamas) on commercial vessels since the middle of Dec-23. The Red Sea region is a systemically important shipping lane that facilitates about 11% of global maritime trade volume as per the IMF. The key chokepoint lies around the Bab el-Mandeb Strait area, which in turn is connected to the Suez Canal, and is an important conduit for global maritime trade, connecting regions like Asia, Middle East, West & North Africa, Europe, and US East Coast.
The ongoing attack by Houthis is forcing shipping vessels to divert to a much longer route around Africa’s Cape of Good Hope. As such, the daily transit trade volume in the Bab el-Mandeb Strait area has dropped by 59% (from 4990 th metric ton to 2040 th metric ton) since the attacks in Dec-23. In the meantime, the Cape of Good Hope has seen an increase in maritime activity by 38% (from 4328 th metric ton to 5964 th metric ton), which has helped to partially offset the overall drag on global maritime trade activity.
Chart 1: Disruption in Red Sea is leading to re-routing of global maritime trade
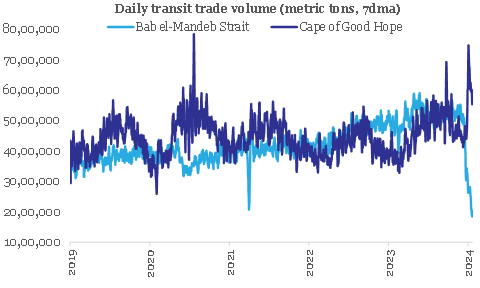
Source: IMF PortWatch, QuantEco Research
This rerouting of global maritime trade is likely to have increased transit time by 2-3 weeks, while also resulting in a price escalation (manifested in the form of higher cost for freight, insurance, etc.).
From India’s perspective, although it’s still early to assess the situation from an economic perspective, one needs to be watchful and cautious of the emerging dynamics of the Red Sea disturbance. Nevertheless, one could monitor India’s trade with Europe and North Africa that is likely to be the most impacted from Red Sea disturbance.
- Europe and North Africa had a share of 17.8% and 1.1% in India’s total trade during Apr-Nov FY24 respectively. India had a larger share of merchandise exports (at 22.7%) going to Europe and North Africa (1.8%) compared to merchandise imports from Europe (14.7%) and North Africa (0.6%) respectively during Apr-Nov FY24.
- Key goods traded include Machinery items, Gems & jewellery, Mineral fuels, Chemicals, Base metals, Vehicle parts, Optical & medical items, Textiles, etc.
Chart 2: India’s trade with Europe and North Africa would be most vulnerable to the Red Sea disturbance
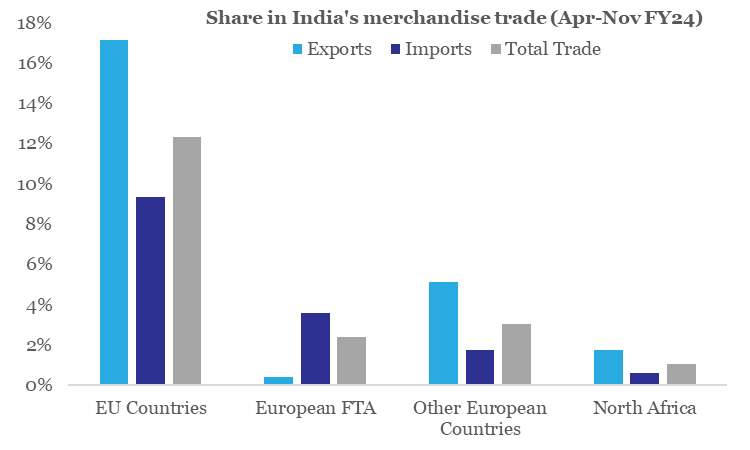
Source: CEIC, QuantEco Research
For India, 2023 has been dismal for exporters, with cumulative exports seeing a ~5% contraction (data available until Nov-23) in value terms over 2022. A cursory glance at India’s headline export performance since 2009 reveals a higher frequency of contraction compared to the earlier period. The 15-year period between 1994-2008 saw just one year of export contraction for India. In contrast, the 15-year period between 2009-2023 saw seven episodes of contraction in India’s exports – that’s almost 47% of the time! Rise of trade protectionism and shortening of global business cycle since the 2008 Global Financial Crisis (besides one-off factors like COVID) appear to have significantly weighed on external trade sentiment.
Chart 3: Key category of traded goods vulnerable to Red Sea disturbance
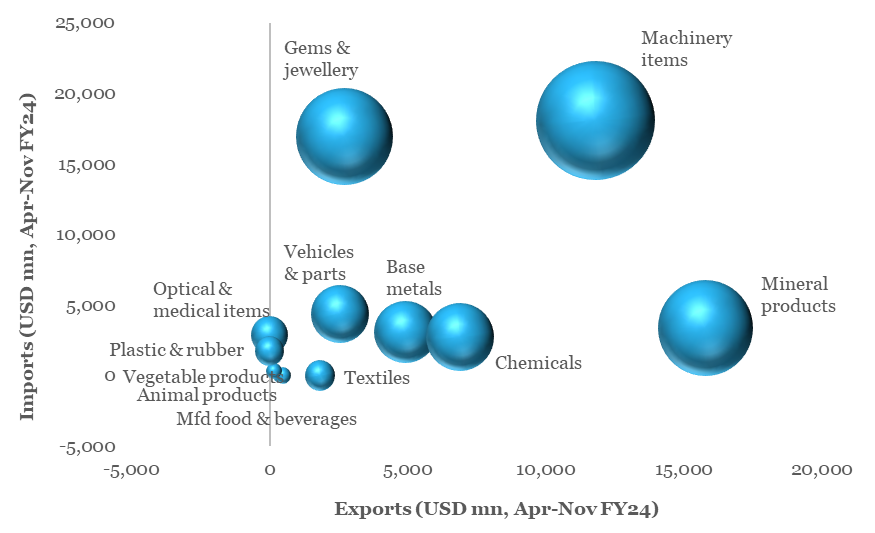
Source: CEIC, QuantEco Research
Note:
(i) Exports and imports represent Top 10 items of India’s trade with Europe and North Africa,
(ii) Size of the bubble denotes value of total trade
Since there is likely to be a cost escalation (which could get passed on if uncertainty persists), the overall impact will depend on price elasticity of individual traded items – in this case low margin items could be vulnerable, while items with solid demand might not feel any pinch. One also needs to consider the impact on quality degradation from delay in trade of agriculture and food related items. Further, the impact could also be felt to extent on India’s trade with US (esp. consignment directed to/from the east coast).
2. Outlook on monetary policy
After maintaining a pause for three consecutive monetary policy reviews between Sep-Dec 2023, the US Federal Reserve is widely expected keep fed fund rate range unchanged at 5.25-5.50% in its forthcoming policy review meeting on Jan 31, 2024. While market participants expect 125-150 bps of cumulative rate cut by the Fed before the end of 2024, recent spate of relatively strong-to-mixed economic data has pushed forward the expected timing of first rate cut from Mar-24 to May-24.
This is somewhat in line with our expectation that the likelihood of an early reversal of the rate tightening cycle by the Fed is relatively low on account of residual inflationary pressures amidst slower than anticipated loss of growth momentum. As such, we continue to expect the Fed to start its rate cutting cycle from Jun-24 onwards.
3. Rupee view
After facing persistent, albeit mild depreciation pressure over five consecutive months, INR is finally trying to recoup some of its losses. It appreciated by 0.2% in Dec-23 (closing the month at 83.21) and has gained another 0.1% in the month of Jan-24 so far (currently trading close to 83.15 levels).
- We continue to believe that INR could remain supportive in Q4 FY24 on account of favorable year-end seasonality and market positioning ahead of India’s inclusion in JPM EM bond index (from Jun-24).
- While global geopolitical risk and domestic election related uncertainties remain on the table, the tail risks have reduced significantly amidst range-bound movement in commodity prices and the recently concluded state elections (that on aggregate basis went in favor of the incumbent BJP government at the centre).
- Notwithstanding the gyrations in market sentiment, the expectation of interest rate easing by the US Fed remains intact. This is bound to be supportive of emerging market currencies in the near-term.
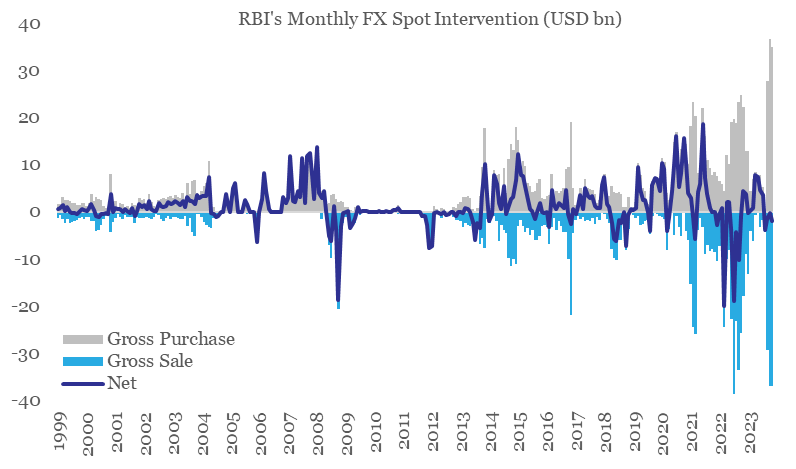
Although the factors for a mild near-term appreciation in INR are emerging, we believe it is unlikely to result in a durable trend due to RBI’s active intervention in the FX market (during Sep-Nov 2023, the central bank cumulatively bought and sold record high amount of USD 99 bn and USD 103 bn on average gross basis respectively, even as the cumulative net intervention was at a paltry USD 3.7 bn of sold position). In addition, Fed’s rate easing cycle in 2024 would soon be followed by key central banks over the medium term, thereby reducing the current bearishness on the USD.
Chart 4: In recent months, FX market has seen record levels of intervention from the RBI
4. CYTD price change in key commodity groups and shipping cost
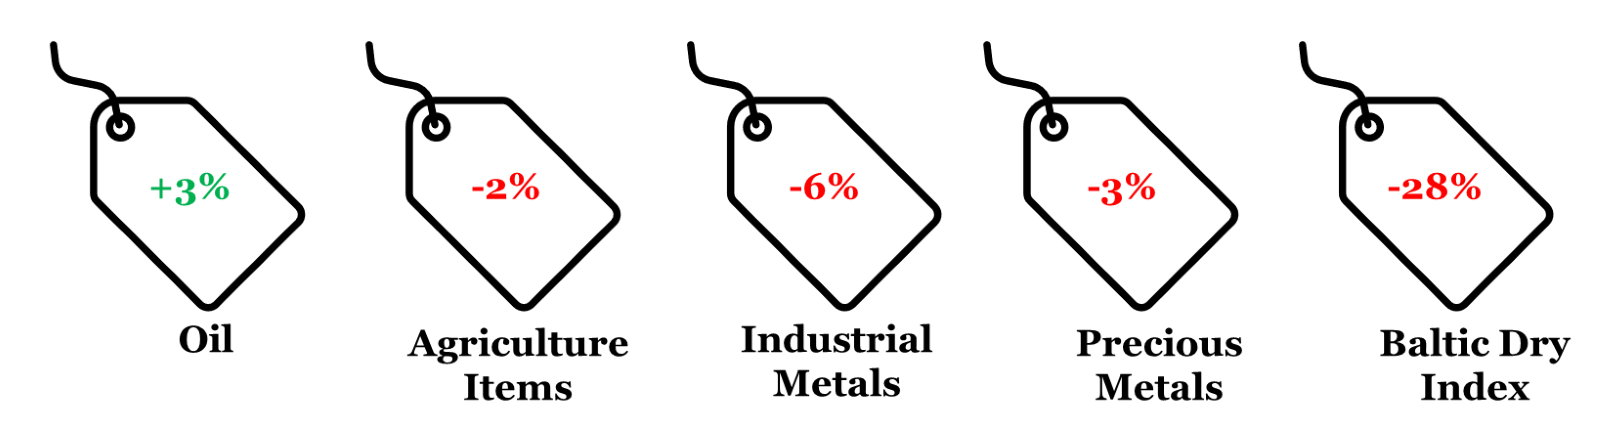
Note: (i) Price change is between Jan 22, 2024 and Dec 31, 2023; (ii) Oil price is represented by Brent; (iii) Agriculture Items, Industrial Metals, and Precious Metals are represented by respective Bloomberg Commodity indices; (iv) rounded off figures represented.
Data: Refinitiv, QuantEco Research
