Aug-23: Global Trade Check | US Fed Rate & Rupee Outlook | New Infographics on Commodity Trends.
1. Global trade review
Global trade volume registered a contraction of 2.4% YoY in May-23. This marked the sixth annualized contraction in trade volume in seven months. Basis, UNCTAD’s nowcast model, we project global trade volume to see an average contraction of 0.9% in Jul-Sep 2023 quarter, marginally better than the estimated contraction of 1.3% during Apr-Jun 2023 quarter.
Chart 1: Volume of global merchandise trade to remain weak in the near-term
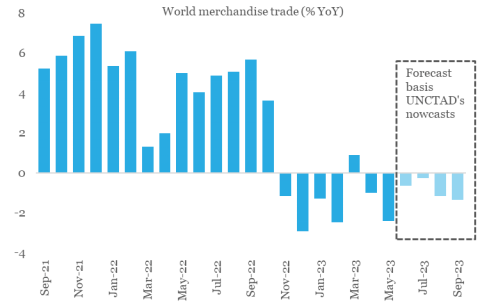
Data: CPB Netherlands, UNCTAD, QuantEco Research
From India’s perspective, we note that key trading partners in developed economies have shown contraction in their import volume in 2023 so far. The forecast of contraction in global trade volume does not augur well for real demand from these economies. Nevertheless, the value of India’s merchandise trade might find some support from firming up of global commodity prices in the last two months.
Chart 2: India’s key export market showing signs of stress
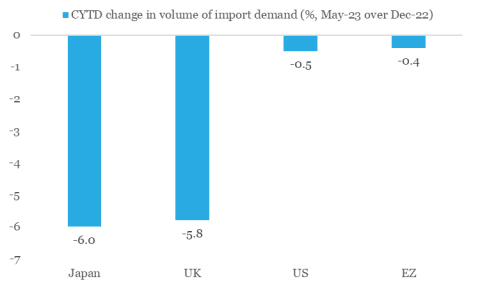
Data: CPB Netherlands, QuantEco Research
Chart 3: Recent pick-up in commodity prices if sustained, will push annualized growth in CRB index to positive territory
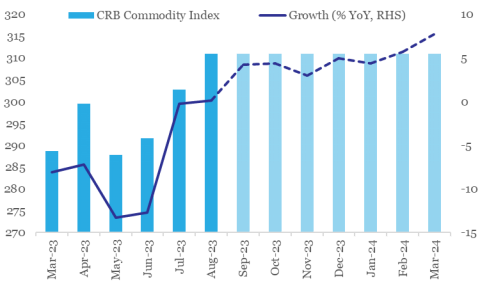
Data: Refinitiv, QuantEco Research
The commodity wise run rate for India’s exports shows a divergent behaviour, although the distribution is negatively skewed on a cumulative basis. For e.g., at one end is Electronics Items, which has outperformed others by posting a robust expansion 37.7% YoY (Apr-Jul FY24 over Apr-Jul FY23), while on the other end of the spectrum is Petroleum Products, which is proving to be a drag with 35.7% YoY contraction.
- The spectacular performance of electronic exports derives support from government’s PLI scheme that has helped it to raise its annualized share in India’s merchandise export basket to 6.1% as of Jul-23, up from its pre COVID level of 3.7% (as of Feb-20).
- A sizeable contraction in petroleum exports is primarily reflective of decline in price. India Crude Basket dropped from an average level of USD 109 pb in Apr-Jul FY23 to USD 78 in Apr-Jul FY24, marking a fall of ~28%.
Chart 4: Notwithstanding the sectoral divergence in export performance, the overall skew is negative
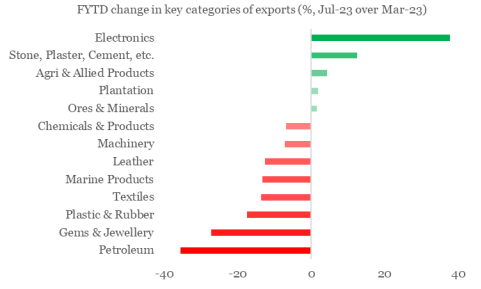
Data: Ministry of Commerce, QuantEco Research
2. Outlook on US monetary policy
After raising monetary policy rate range from 0.00-0.25% in Mar-22 to 5.25-5.50% in Jul-23, the US Federal Reserve has delivered a cumulative rate hike of 525 bps in a span of 17-months. That is tantamount to having an average rate hike of 31 bps for 17-consecutive months. Besides other factors, this has contributed towards CPI inflation in US moderating from its peak of 9.1% in Jun-22 to 3.2% in Jul-23. Despite US economy showing signs of some resilience, monetary policy seems to be having the desirable impact (that of curbing inflation), albeit with a lag. As per last FOMC (Federal Open Market Committee) in Jun-23, the Fed members projected the median fed funds target range at 5.50-5.75% before the end of 2023. This implies scope for one more rate hike before the Fed reaches its interest rate peak in the current cycle.
Market participants are currently attaching a ~31% probability to a rate hike by Nov-23, followed by a pause until Mar-24. As of now, market participants expect the Fed to commence its rate easing cycle from May-24 onwards, with likelihood of a cumulative 100 bps rate cut before the end of 2024. This is in line with the FOMC projections made in Jun-23.
3. Outlining our expected rupee trajectory
The Indian Rupee weakened to a record low in Aug-23 on the back of a combination of factors:
- Monetary policy divergence between the two largest countries (US poised for one final round of rate hike while China just delivered two rate cuts) is resulting in a stronger USD and a weaker CNY. Both individually are responsible for weighing upon INR.
- Recent jump in global commodity prices, esp. crude oil, from an average of USD 75 pb in Jun-23 to USD 87 pb in Aug-23 (so far) would widen the trade deficit.
We expect the above-mentioned factors to persist in the near term because of which INR could weaken towards 84 levels within the next 3-months. Going forward, we expect the INR to partially reclaim lost ground and move towards 82 levels amidst favorable Q4 seasonality and anticipated USD weakness as market participants position for a pivot in US monetary policy cycle later in the year.
Chart 5: Adverse Q2 seasonality is catching up with rupee
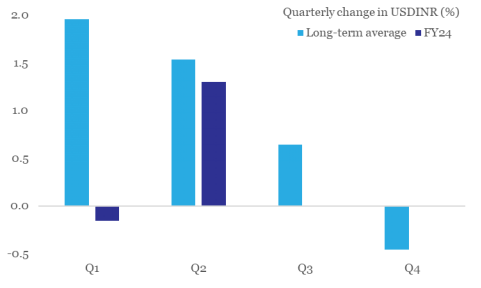
(Data: Refinitiv, QuantEco Research)
4. Key CYTD changes in price

Note: Price change is between Jul-23 and Dec-22 for respective generic indices
( Data: World Bank, Refinitiv, QuantEco Research)
5. Key events worth tracking