GEOECONOMIC AND GEOPOLITICAL UNCERTAINTY; OUTLOOK ON MONETARY POLICY AND RUPEE
The Apr-Jun 2025 quarter marked a turning point in the global economy, with rising trade barriers and geopolitical tensions dampening global demand. Amidst this, India stayed focused on stability and trade openness, eyeing key bilateral agreements like the anticipated India-US BTA.
Credlix
1. Sharp escalation of geoeconomic and geopolitical uncertainties
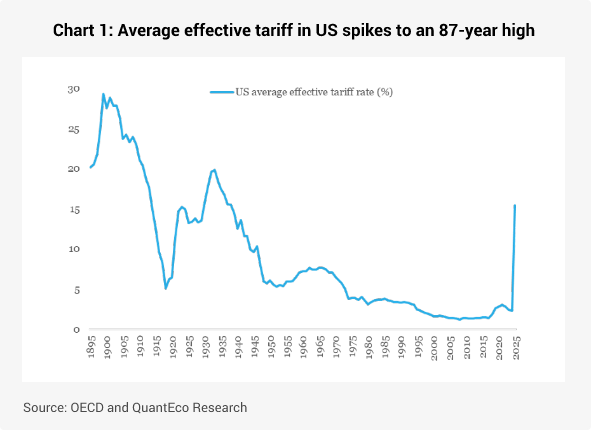
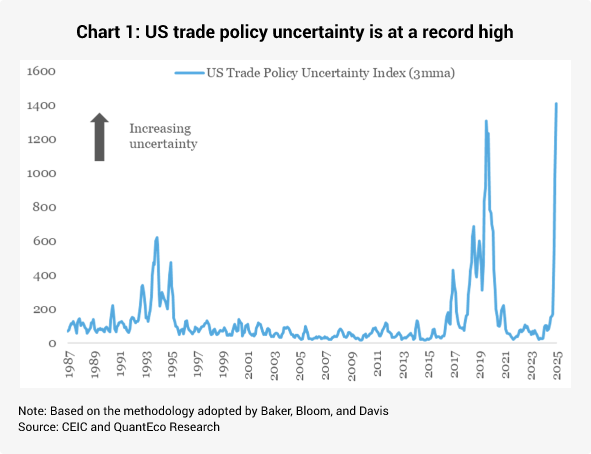
The Apr-Jun 2025 quarter has turned out to be a watershed moment for the global economy. The ongoing quarter witnessed unprecedented uncertainty on the prospects of international trade, triggered by widespread imposition of tariffs by the US President Trump1. As per the OECD, the average effective rate of tariff imposed by the US shot up from 2.3% in 2024 to an estimated level of 15.4% currently2 – this puts it at the highest level in 87 years.
Notably, this weighted average tariff could change in the coming months as the country level tariffs would eventually get determined by the outcome of bilateral trade/investment deals that the Trump led US administration is impressing upon3.
The US imported USD 87 bn worth of goods from India in 2024, making it the 10th largest import partner, with a share of 2.7%. From India’s perspective, the US was the largest export destination in 2024, having a share of 18.2%.
Of the total items exported by India to the US in 2024-25, the share of top 15 items (based on HS Code classification) constituted 80.2% in value terms, with Electrical equipment, Gems & jewellery, Pharmaceutical products, Machinery items, Textiles, and Iron & steel forming the bulk of the shipment.
Table 1: India’s exports to the US is concentrated in top 15 items
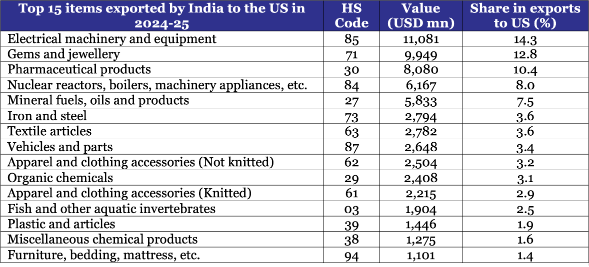
Source: Ministry of Commerce and QuantEco Research
The US had in place a weighted average MFN rate of tariff of 2.4% on India as of end 2024. The US President Trump proposed a reciprocal tariff rate of 26% for India in his ‘Liberation Day’ announcement4. Within a week, this was pruned to a baseline reciprocal tariff rate of 10% for all countries (except China) for a temporary period of 90-days.
Table 2: Broad overview of tariffs: India vs. the US
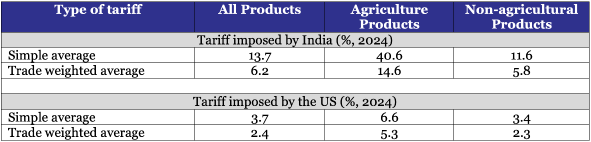
Source: WTO and QuantEco Research Note: India’s tariffs are likely to be marginally lower than the reported figures by the WTO as it does not take into account select easing of custom duty announced in the Union Budget for 2025-26.
The status of US tariffs will be up for assessment on July 9th, when the temporary tariff truce period ends. As per media reports, the trade and commerce ministries in both countries are working towards announcing the first leg of the India-US Bilateral Trade Treaty (BTA) before the July 9th deadline. News reports suggest that while there has been significant progress on bilateral negotiations, differences on tariffs and market access with respect to agricultural items still need to get ironed out.
Meanwhile, India announced its FTA with the UK in May 2025 (details provided in the box below). In the next few months, the deal will get its fine print and is expected to get implemented from 2026 onwards in a phased manner. This will hopefully provide a template for the anticipated trade agreements with the US and the EU.
India and EU will review their FTA negotiations and finalize a strategic agenda during European Commission President’s visit in Mar-25. Upon finalization, this would become India’s largest ever FTA, granting improved market access for sectors such as textiles, leather, and marine products. The EU is India’s second-largest export market after the US.
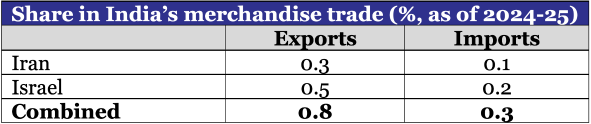
Even as the tariff related uncertainty clouds the global economic outlook, the geopolitical risk in West Asia has spiked with the intense armed conflict between Israel and Iran that began from Jun 13th. Although there is reportedly a ceasefire (with intermediation by the US) now, the situation remains fragile.
The simmering of geopolitical risk in the Middle East since the Israel-Hamas war in 2023 has weighed upon trade activity. India’s combined merchandise trade with Israel and Iran stood at just USD 5.4 bn in 2024-25, down from USD 8.4 bn in 2023-24. Key products involved in trade with both the nations include Cereals, Edible fruits & nuts, Gems & jewellery, Ceramic products, etc.
Source: WTO and QuantEco Research
Given limited trade exposure, any potential escalation of the Israel-Iran armed conflict would have insignificant direct implications for India. However, Iran has strategic control of the Strait of Hormuz, a key chokepoint for world energy trade that witnessed ~27% of maritime energy trade volume in 2023 (as per estimates by the US EIA). In case of a severe escalation, the possibility of closure of the Strait of Hormuz cannot be dismissed. In a worst case scenario, this could lead to a temporary sharp spike in crude oil price, which could impact import dependent economies like India. As per RBI’s estimates, for every $10 increase in crude oil price (assuming complete pass-through):
• CPI inflation moves up by 30 bps
• GDP growth moderates by 15 bps
While having these statistical sensitivities of India’s growth-inflation balance to the price of crude oil is useful, we do acknowledge that crude oil prices have retreated currently on the back of the talk of ceasefire between Israel and Iran – from a high of $80 pb seen earlier in the month, the price of Brent has corrected to $68 pb currently. Notably, the average price of Brent during Apr-Jun 2025 is tracking $68 pb, lower than the average price of $76 pb seen in Jan-Mar 2025 quarter s well as lower than the average price of $85 pb recorded in the Apr-Jun 2024 quarter.
India-UK Free Trade Agreement
On May 6, 2025, India and the UK announced the successful conclusion of the bilateral FTA after negotiating for more than three years. The FTA takes place in the backdrop of growing economic relations between India and the UK as exemplified in the bilateral trade of about USD 60 bn (total merchandise trade stood at USD 23 bn in 2024-25 with India having a USD 6 bn surplus) which is projected to double by 2030. At a broader level, the India-UK FTA is notable for its spread that encompasses goods and services, digital trade, government procurement, intellectual property, labour, gender, anti-corruption and environmental standards.
Select highlights:
• Nearly 44% of India’s exports to UK (like textiles, footwear, carpets, cars, seafood, fruits, etc.) will now get duty-free access. These items earlier faced duties ranging between 4-16%. The remaining ~66% of India’s exports (covering petroleum, pharma, gems & jewellery, vehicle parts already had duty-free access).
• In return, India will cut tariffs on 90% of UK goods. At the onset, 64% of these would get duty-free access (involving items like salmon, lamb, aircraft parts, machinery, and electronics). Over a period of 10 years, India will lower tariffs on the remaining 26% of UK goods (like chocolates, soft drinks, cosmetics, and auto parts) in a phased manner.
• UK will provide 1800 visas on annual basis for independent service professionals (like yoga instructors, musicians, chefs), contractual service suppliers (business visitors, investors, etc.).
• India will grant UK firms the access to central government’s procurement in sectors such as transport, green energy, and infrastructure.
• Indian workers temporarily in the UK will now be exempted from paying social security contributions in the UK for a period of 3 years under the Double Contribution Convention.
Monetary Policy: US Fed maintaining caution while RBI goes for growth
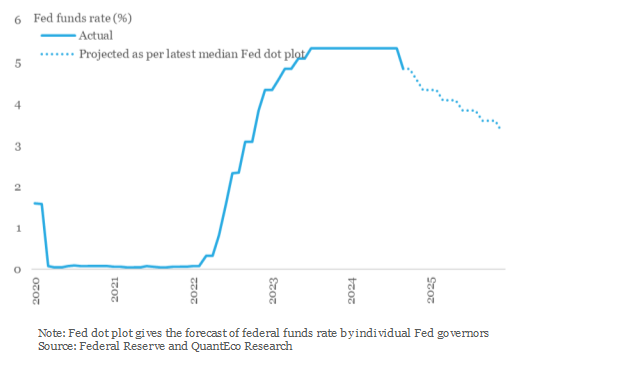
After cutting interest rate by a cumulative 100 bps in 2024, the US Federal Reserve has been on pause since then. At its monetary policy review in June 2025, the median economic forecast by Fed governors point towards a worsening of the growth-inflation balance for both 2025 and 2026:
• GDP growth forecasts for 2025 and 2026 were revised lower by 30 bps and 20 bps to 1.4% and 1.6% respectively.
• Core PCE inflation forecasts for 2025 and 2026 were revised up by 30 bps and 20 bps to 3.1% and 2.4% respectively
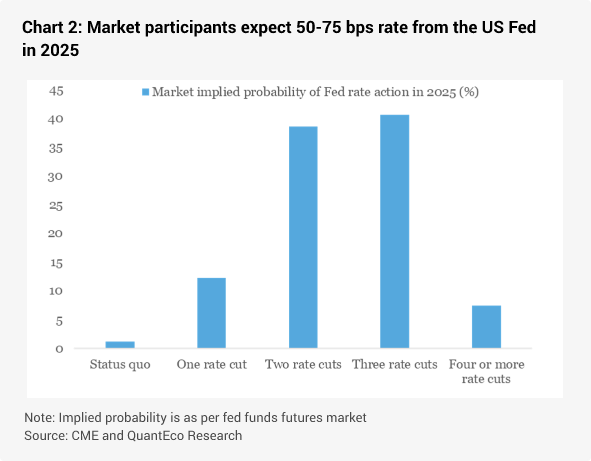
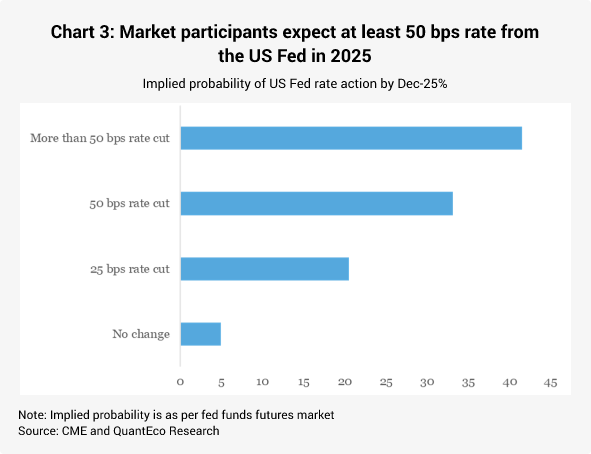
As such, the FOMC (Federal Open Market Committee) in its June 2025 policy review not just maintained its policy rate in the 4.25-4.50% range, but more importantly, it continued to project space for 50 bps cumulative rate easing before the end of 2025, while reducing the cumulative rate cut in 2026 to 50 bps from 75 bps earlier.
In recent weeks, the US economic data, esp. labour market indicators, has turned soft. In addition, the political pressure to ease interest rates has seen a build-up. As such, market participants are currently pricing in 125 bps cumulative rate cut over 2025-2026, higher than Fed’s projection of 100 bps.
Contrary to the conditions in the US, where the tariff threat is expected to weigh upon inflation, which in turn is keeping the Fed cautious – India, is witnessing a strong disinflationary pressure from food items. In its last monetary policy review in June 2025, the RBI revised lower its CPI inflation forecast by 30 bps to 3.7% – if realized this will be the lowest inflation in the post COVID period. With inflation projected to be lower than the 4% target, the RBI used the space to deliver 50 bps cut in the repo rate to 5.50%. This was accompanied by the announcement of 100 bps reduction in the CRR (Cash Reserve Ratio for banks) to 3.00%. The jumbo-sized policy easing was balanced by a shift in the monetary policy stance to ‘neutral’ from ‘accommodative’ – essentially implying status quo in the near future with data dependent action thereafter. We expect this will provide clarity to the banking and financial system and boost monetary policy transmission, in favor of lower interest rates in the economy.
3. Rupee view
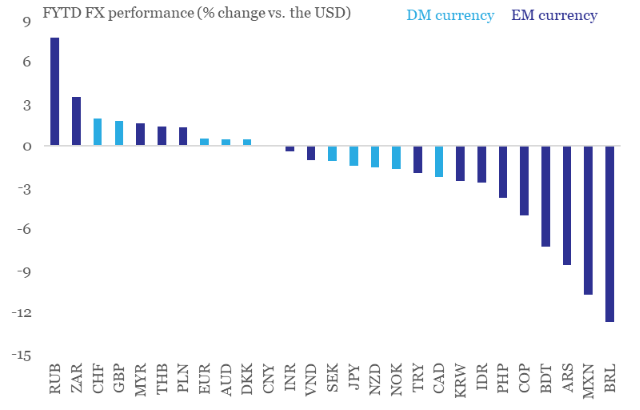
After two back-to-back months of appreciation in February and March 2025, the Indian rupee posted a modest depreciation of 0.5% in May 2025 vs. the US dollar. The month of June 2025 so far has witnessed an extension of this trend, with INR losing 0.5% vs. the USD.
The broader theme of USD weakness continues to dominate the global FX market sentiment amidst heightened policy uncertainty in the US. Currencies like the CHF and EUR have seen the maximum strength against the USD amongst developed market currencies, while RUB and KRW have posted strong performance amongst emerging market currencies.
While USD continues to see some erosion of its safe haven appeal, the bearish market positioning is getting stretched – this could potentially reverse in the short-term, hopefully dovetailing with ebbing of heightened trade uncertainties by Sep-25. US Fed’s wait-and-watch approach, in contrast to other key central banks that have eased monetary policy in recent months, could also provide a minor tailwind to the USD.
Meanwhile, INR could enjoy strategic gains in the near term on account of recent slide in inflation and the front loading of exports to the US. However, we believe this to be transitory, and likely to be actively defended by RBI intervention to recoup reserves. We maintain our medium-term call of moderate weakness in the INR and expect it to drift towards 89.50 by Mar-26 for now. We shall review the call post the announcement of the India-US BTA.

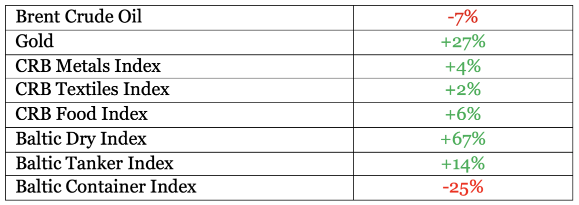
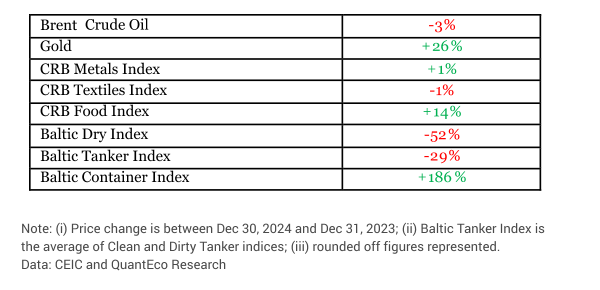
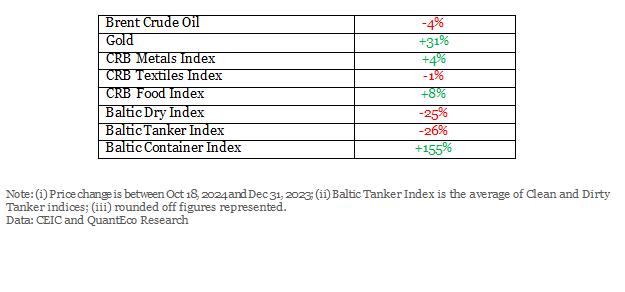
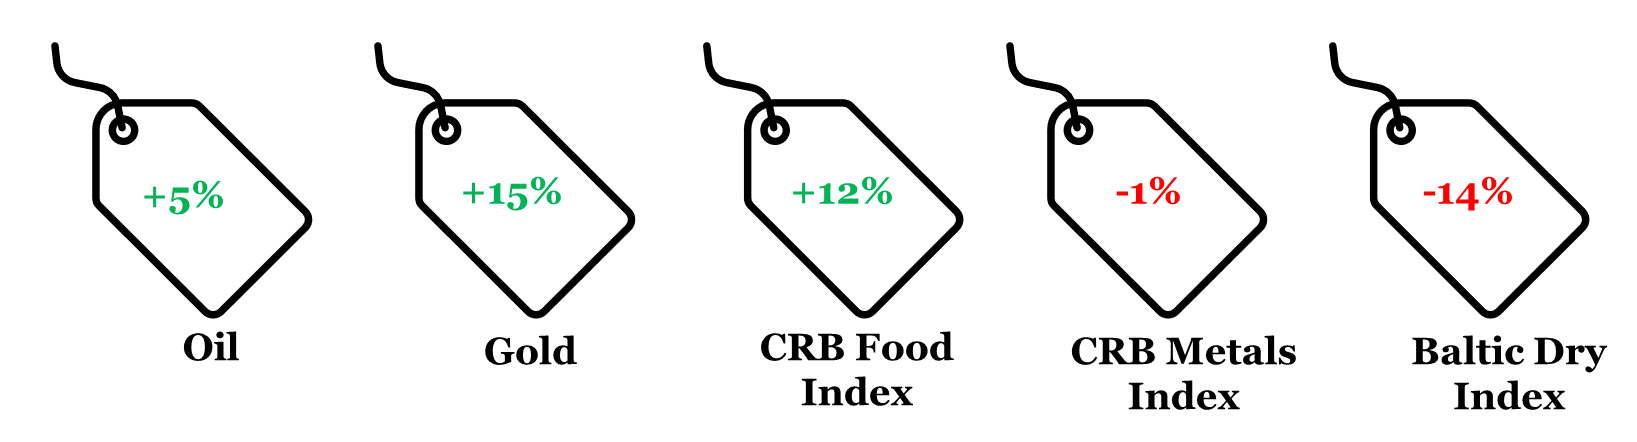
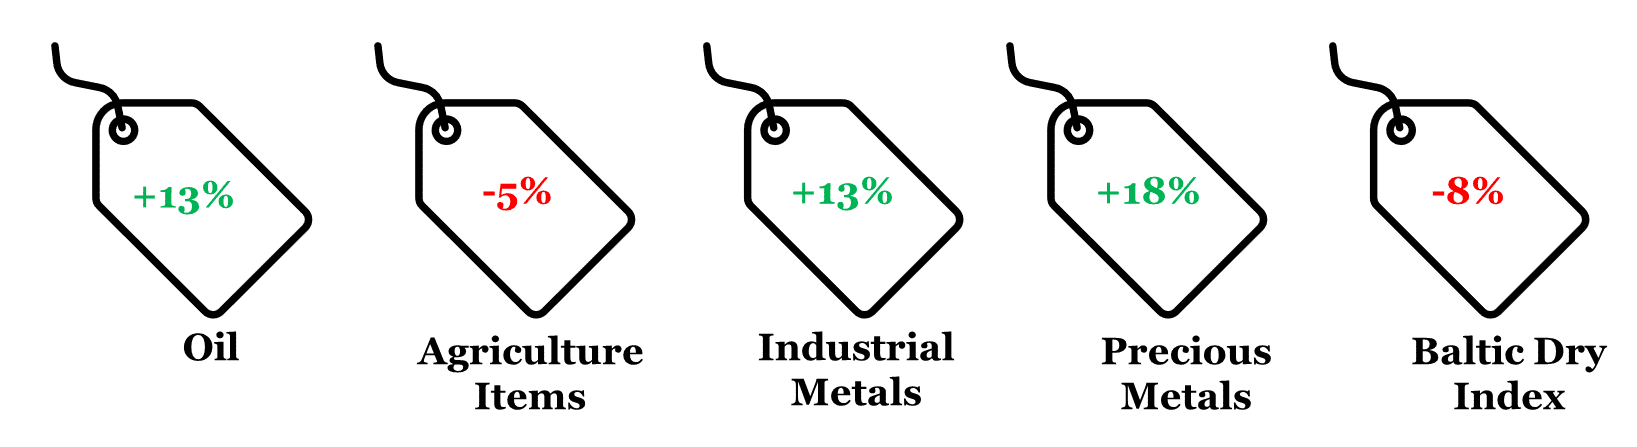
4. CYTD price change in key commodity groups and shipping cost

FY26 Union Budget; Trade tantrums; Outlook on monetary policy and rupee
The calendar year 2025 has started on a cautionary note as far as global trade is concerned. The new US administration is prioritizing protectionism over sound economic wisdom. This could lead to a reset in the global trade order, with the burden of adjustment on rest of the world, at least in the near term. Meanwhile, India seems to be treading a cautious and calculated path, with focus on domestic macroeconomic stability along with openness for laying the groundwork for a strategic trade agreement with the US. On the domestic front, the government presented the Union Budget for 2025-26. We parse through the signals to look at key takeaways along with implication for exporters. This is followed by a quick assessment of US and India’s monetary policy along with the outlook on the Indian rupee.
1. Union Budget 2025-26: Focuses on macro-stability
The central government presented its annual budget for 2025-26 on Feb 1st. At a broad macro level, the fiscal policy has provided five important signals:
· Progress on fiscal consolidation: At the outset, the Finance Minister revised lower the fiscal deficit target for 2024-25 to 4.8% of GDP from 4.9% budgeted earlier. For 2025-26, the budget will continue to prioritize consolidation, with lowering of fiscal deficit target to 4.4% of GDP, the lowest in the post-COVID phase.
· Pre-emptive move on tariff rationalization: With the US announcing that it will impose reciprocal tariffs on its trade partners from Apr-25 onwards, the 2025-26 Union Budget has opted for rationalization of the tariff structure. The basic customs duty on as many as 30 items that covers luxury vehicles, chemicals, solar cells, and machinery will be lowered along with a mark down in the peak import tariff from 150% currently to 70%, resulting in the average tariff rate falling to around 11% from 13% currently.
· Mini consumption stimulus: Rates and slabs for personal income tax will be changed from 2025-26 to raise the ‘nil tax’ slab to Rs 12.75 lakhs pa (with standard deduction) from Rs 7 lakh pa currently. This is expected to benefit approximately 3 cr middle-class taxpayer and could potentially provide up to 30 bps impetus to GDP growth in 2025-26 as per our estimates.
· Continued focus on capital expenditure: Allocation for capital expenditure is set to remain high at 3.1% of GDP in 2025-26. Bulk of the central government’s capex allocation in 2025-26 (~62%) will be geared towards the transport (esp. roads and railways) and defence sectors.
From the perspective of MSMEs, the Union Budget for 2025-26 has few salient takeaways:
· The budgetary allocation for the Ministry of MSME will see ~34% hike in 2025-26 to Rs 23,168 cr.
· The investment and turnover limits for classification of MSMEs will be raised by 2.5x and 2.0x respectively.
· Financing to receive a boost from (i) enhancement of CGTMSE cover and Credit Guarantee, (ii) provision of customised credit cards for UDYAM registered enterprises, (iii) new scheme for term loans for 5 lakh first-time entrepreneurs, and (iv) revamping of the PM SVANidhi scheme.
· Labour intensive sectors (footwear, leather, and toys) will get new schemes in 2025-26; Government to position India as a global toy hub.
From the perspective of exporters, the Union Budget for 2025-26 has the following takeaways:
· Ministries of Commerce, MSME, and Finance will collaborate to set up an Export Promotion Mission to facilitate easy access to export credit, cross-border factoring support, and support to MSMEs to tackle non-tariff measures in overseas markets.
· A unified digital public infrastructure platform – Bharat Trade Net, will be set-up for streamlining all trade documentation and financing solutions. This will complement the Unified Logistics Interface Platform.
· Infrastructure and warehousing for air cargo including high value perishable horticulture produce will get be upgraded. Cargo screening and customs protocols will be streamlined and made user-friendly.
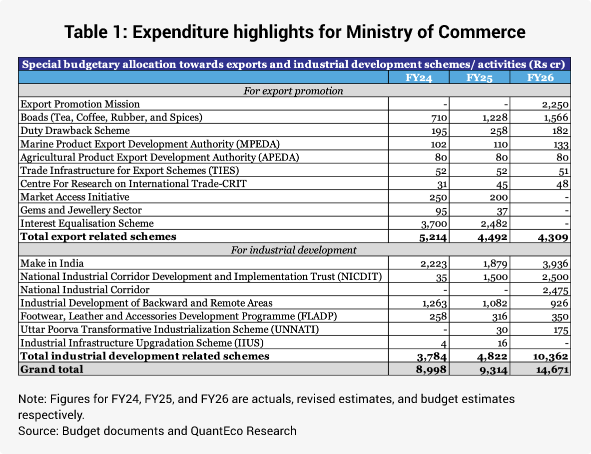
While that’s encouraging, specific allocation towards export promotion under the Ministry of Commerce will see a marginal decline to Rs 4309 cr in 2025-26 from Rs 4492 cr in 2024-25. This will primarily be on account of expiry of the Interest Equalisation Scheme. Having said, the commerce ministry is expected to raise its contribution towards promotion of domestic manufacturing via sharp increase in allocations for Make in India and National Industrial Corridor.
2. Trump tariff tantrums
The spectre of tariff related disruption to global merchandise trade appears more plausible than ever before. In less than one month of assuming office, US President Trump has caused tremors in the hitherto prevailing merchandise trade arrangements. The new administration has implemented 10% tariffs on all imports from China. A universal tariff of 25% on steel and aluminium has also been announced, while the announced 25% tariffs on all imports from Mexico and Canada is currently on pause until the end of Feb-25. The Trump administration has also announced its intent to impose reciprocal tariffs starting Apr-25, with coverage extending to all trading partners to achieve equalization of tariff rates with the US.
The imposition of reciprocal tariffs might have ramifications for the Indian economy – after all, US had a share of 17.7% in India’s merchandise exports, 6.2% in merchandise imports, and 10.7% in total merchandise trade, thereby making it India’s largest trade partner in 2023-24.
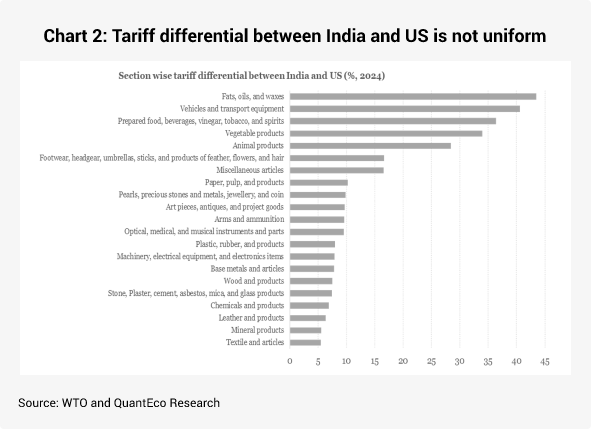
From US’s perspective, while India stood as the 10th largest merchandise trade partner in 2024, it had the highest rate of tariff (India imposes MFN rate of tariff on all countries with which it does not have an FTA). As of 2023, India’s trade weighted average MFN tariff stood at 12.0% vis-à-vis the corresponding rate of tariff imposed by US at 2.2%. This puts the tariff differential between India and US at 9.8% (as of 2023), one of the highest among major trading partners.
· The tariff differential between India and US is under 10 percentage point for 66% of goods
· Extremely high differential of more than 100 percentage point exists only in case of 0.5% of the goods
Hence, while India’s tariff rates are undoubtedly higher vis-à-vis the US, it is not uniform across the commodity items and appears to be rather on account of select items. For e.g., at a section wise level, the tariff differential is highest in case of animal and vegetables fats, oils and waxes at 43.5%, while the lowest differential is seen in case of textiles and products, at 5.5%.
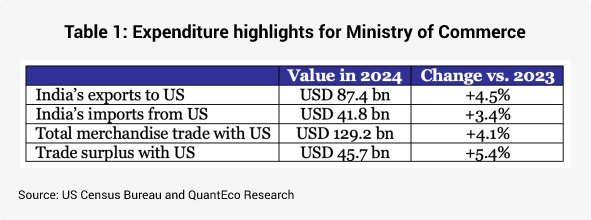
Value in 2024 Change vs. 2023
India’s exports to US USD 87.4 bn +4.5%
India’s imports from US USD 41.8 bn +3.4%
Total merchandise trade with US USD 129.2 bn +4.1%
Trade surplus with US USD 45.7 bn +5.4%
As of now, it is not clear how the US administration is going to approach the notion of reciprocal tariffs. The implied tariff differential would change depending upon whether the US administration decides to focus on the country wise differential, sector wise differential, or item wise differential. A bigger uncertainty stems from the treatment of non-tariff measures. As per our estimates, in the last 15-years, US has imposed 3.9x more discriminatory non-tariff measures on India. In all appropriateness, the US administration needs to undertake a comprehensive assessment of both tariff and non-tariff measures before imposing reciprocal tariffs on India (or for that matter any other country).
India has already offered an olive branch to the US by pre-emptively pruning custom duties for select items in the Union Budget for 2025-26. As per media reports, India’s Ministry of Commerce is preparing a supplementary list of items which might see tariff rationalization in Mar-25, before reciprocal tariffs are set to be activated in Apr-25. More importantly, the recent visit by PM Modi to the US in Feb-25 appears encouraging.
· India and US have set a bilateral trade (including both goods and services) goal of USD 500 bn by 2030 vis-à-vis USD 195 bn in 2023.
· As a major step towards this journey, there is likely to be an announcement of a Bilateral Trade Agreement in the final quarter of 2025. To advance this innovative, wide-ranging BTA, the US and India will take an integrated approach to strengthen and deepen bilateral trade across the goods and services sector, and will work towards increasing market access, reducing tariff and non-tariff barriers, and deepening supply chain integration.
· India has agreed to increase trade share in the area of energy items, defense, and technology and innovation, besides strengthening multilateral cooperation and people-to-people connect.
On a separate note, India is attempting to diversify its trade engagements with other countries.
· India and Qatar are exploring the possibility of entering into a bilateral Comprehensive Economic Partnership Agreement, with the objective of doubling the bilateral trade by 2030.
· India-UK negotiations have got fast tracked to finalize the FTA.
· India and EU will review their FTA negotiations and finalize a strategic agenda during European Commission President’s visit in Mar-25. Upon finalization, this would become India’s largest ever FTA, granting improved market access for sectors such as textiles, leather, and marine products. The EU is India’s second-largest export market after the US.
3. Monetary Policy: US Fed at a crossroad
After decisively cutting fed funds rate by a cumulative of 100 bps between Sep-Dec 2024, the US Federal Reserve now finds itself at crossroads. The path towards lower interest rates is now facing resistance from US economic resilience and the likely pressure on US debt from Trump’s anticipated fiscal expansion. More importantly, the likely imposition of tariffs by the incoming US administration under the leadership of Trump poses the risk of fanning inflationary pressures.
This has resulted in the US Fed members scaling back their projected rate cut expectations by 50 bps for 2025 (the Fed now projects room for a cumulative 50 bps rate cut in 2025 vs. its earlier forecast of 100 bps cut in 2025).
In case of India, the RBI announced its first rate cut in five years, with a 25 bps cut in the repo rate (to 6.25%) at its Feb-25 policy review meet. Correction in food prices in the last three months helped in lowering CPI inflation from its recent peak of 6.21% in Oct-24 to 4.31% in Jan-25. We believe the benign trend in food inflation is likely to prevail in the near-term, thereby providing room to the RBI to undertake additional 25 bps rate cut in its next policy review in Apr-25. Having said, the likelihood of lower degree of monetary easing from the US Fed here on in 2025 along with relatively sharp pace of weakness in the Indian rupee in recent months could restrain the scope for monetary easing thereafter.
4. Rupee view
The Indian rupee started the calendar year 2025 on a sombre note by extending the weakness seen in the last quarter of 2024. Subdued sentiment for rupee continues to persist, with the
currency breaching the 87.5 level earlier in Feb-25. However, since then, the currency has a made a comeback, aided by RBI’s interventions.
As far as the RBI is concerned, there now appears to be a somewhat greater tolerance for INR flexibility. While prima facie it would be difficult to ascribe a cause for the change in the central bank’s reaction function towards exchange rate management, a gradual build-up in INR overvaluation over last 3-quarters, decline in RBI’s FX import cover due to sizeable intervention since Oct-24, and a need for currency adjustment in a new global trade order could be possible reasons towards the same.
We expect USDINR to trade close to 87.50 levels by Mar-25, while acknowledging that the near-term trajectory could potentially see above normal volatility on account of known-unknown risks. Going into next financial year, we expect USDINR to move towards 89.50, before Mar-26. Having said, upside risks to USDINR have strengthened post RBI’s greater tolerance for a weaker currency and more importantly due to heightened geopolitical and geoeconomic uncertainties.
5. CYTD price change in key commodity groups and shipping cost

Optimism on global trade giving way to caution; outlook on monetary policy and rupee
In this month, we take stock of the performance of global merchandise trade in 2024 along with India’s relative position. Global trade faces considerable uncertainty from the likelihood of another US led tariff war in 2025. We also undertake a quick assessment of US and India’s monetary policy along with the outlook on the Indian rupee.
1. Round-up of global trade performance in 2024
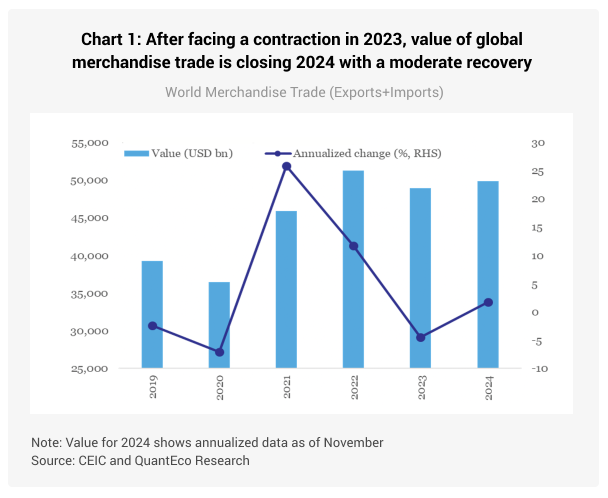
Global merchandise trade staged a recovery in the calendar year 2024, with growth in exports outpacing imports.
· As per our estimates, the value of global merchandise exports clocked an expansion of 2.2% between Jan-Nov 2024 compared to a contraction of 3.4% seen in the corresponding period in 2023.
o India’s merchandise exports depicted a broadly similar outturn, i.e., after contracting by 5.3% between Jan-Nov 2023, clocked a moderate recovery, expanding by 3.0% between Jan-Nov 2024.
· The value of global merchandise imports clocked a mild expansion of 1.7% between Jan-Nov 2024 compared to a contraction of 5.6% seen in the corresponding period in 2023.
o India’s merchandise imports depicted a broadly similar outturn, i.e., after contracting by 6.4% between Jan-Nov 2023, showed a moderate recovery, expanding by 6.8% between Jan-Nov 2024.
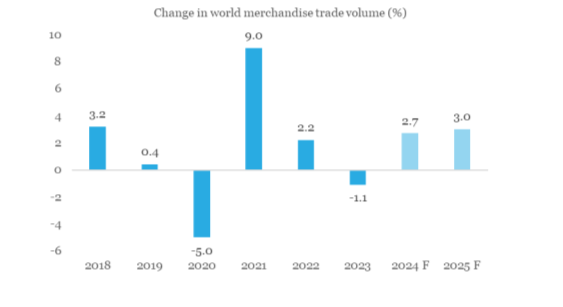
This is broadly consistent with the estimates provided by the WTO – the multilateral body had projected world merchandise trade volume to expand by 2.7% in 2024 vs. an estimated contraction of 1.1% in 2023. Notwithstanding the persistence of geopolitical uncertainties, efforts by central banks in several countries to start unwinding policy tightness appears to have provided a supportive backdrop.
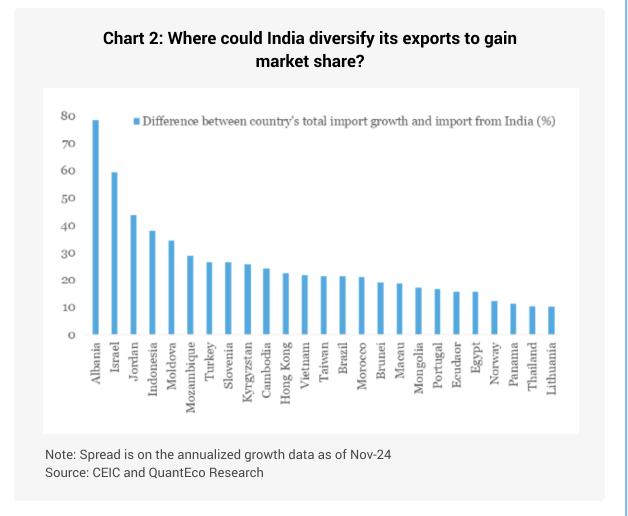
From India’s perspective, we note that while it’s estimated share in global merchandise exports stood unchanged at 1.7% in 2024 (same as in 2023), it’s share in global merchandise imports increased to a fresh all-time high of 3.0% in 2024 (vs. 2.9% in 2023).
While record high price of precious metals may partly explain the bulge in India’s merchandise imports in 2024, we believe there is scope for improvement in India’s export performance. For example, the chart below illustrates the difference between the growth in individual country’s headline merchandise import vis-à-vis its import from India. Although the framework is simplistic and ignores the role of geopolitical, operational (like trade costs etc.), and structural factors (role of comparative advantage, etc.), it nevertheless shows the gap between the potential scope and actual performance for destination of India’s exports.
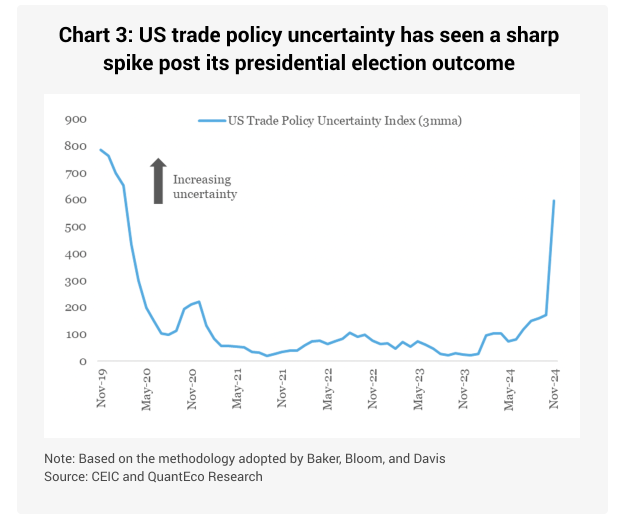
2. The incoming global trade uncertainty
Donald Trump, who emerged victorious in the recently concluded US presidential elections, will start his second term at the oval office from Jan-25. Unlike the previous term, the
incoming term will see greater majority for Republicans in the Senate as well as the House, thereby providing better policy manoeuvrability. President-elect Trump is widely known for using tariffs as tool for international negotiations. He has promised that under his administration, the US would impose a universal tariff of 10% on all major trading partners, along with a higher rate of tariff of 25-60% for countries like Mexico, Canada, and China.
As per the Peterson Institute for International Economics, if tariffs are levied on all US trade partners as well as China, large flows of machinery, electronics, transportation equipment, and chemicals will be subject to new taxes, with much of the burden falling on US-based businesses. Consumers, however, will also see higher costs for imported final goods, including electrical devices, toys and sporting goods, vegetable and meat products, and imported foodstuffs.
While there is heightened macro uncertainty on the prospects of global trade for 2025, there is also considerable micro uncertainty on the implementation of proposed tariffs by the incoming US administration. It is unclear if the proposed tariffs would have a list of exempted products, or whether the FTA partners would receive a preferential treatment. There is also a high possibility of retaliation from US trade partners as the proposed tariffs by the US administration could violate WTO and FTA commitments. The likely retaliation could take many forms, ranging from reciprocal tariffs to imposition of non-tariff measures, and incorporating currency adjustments.
Last but not the least, any widespread use of tariffs could also face resistance from domestic manufacturers in the US, some of whom would be reliant upon global value chains for inputs. Hence, it remains to seen how the incoming administration balances economic pragmatism vs. election rhetoric.
3. India’s FYTD export performance
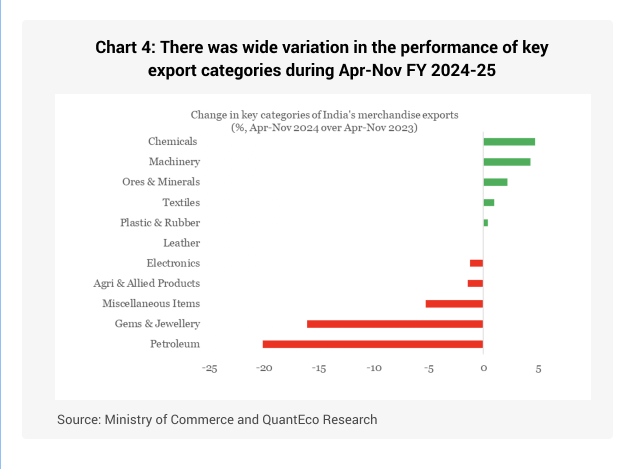
As per preliminary estimates from the Ministry of Commerce, India’s merchandise exports grew at a moderate rate of 2.2% to USD 284 bn during Apr-Nov FY 2024-25 from USD 278 bn in the corresponding period in FY 2023-24. At a granular level:
· Top 5 items that recorded the fastest growth were Coffee, Tobacco, Electronic goods, Plastic and linoleum, and Tea.
· Bottom 5 items in terms of growth were Miscellaneous cereals, Iron ore, Petroleum products, Oil meals, and Gems and jewellery.
· The annualized share of Electronic items in India’s export basket currently stands at its highest level of 7.7%.
· The annualized share of Gems and jewellery items in India’s export basket currently stands at its lowest level of 6.9%.
4. Monetary Policy: US Fed at a crossroad
After decisively cutting fed funds rate by a cumulative of 100 bps between Sep-Dec 2024, the US Federal Reserve now finds itself at crossroads. The eagerness to lower the monetary policy rate is now facing resistance from US economic resilience. More importantly, the likely imposition of tariffs by the incoming US administration under the leadership of Trump poses the risk of fanning inflationary pressures.
This has resulted in the US Fed members scaling back their projected rate cut expectations by 50 bps for 2025 (the Fed now projects room for a cumulative 50 bps rate cut in 2025 vs. its earlier forecast of 100 bps cut in 2025). Post the presidential election outcome, market participants have also pared their expectation of the likely dose of US rate cuts – current interest rate futures pricing suggest the likelihood of 25-50 bps rate cut through the course of 2025.
In case of India, the RBI shifted its monetary policy stance to ‘neutral’ from ‘withdrawal of accommodation’ in its Oct-24 policy review and followed it up with a 50 bps CRR cut in the Dec-24 policy review. While the shift in monetary policy stance happened without any change in the monetary policy rate (repo rate continues to remain at 6.50%), we believe it is a precursor for easing of interest rates in the near future. Depending upon the anticipated correction in domestic food prices and its overall impact on CPI inflation, market participants expect the RBI to deliver its first rate cut in Feb-25 policy review. However, the likelihood of
lower degree of monetary easing from the US Fed in 2025 could have some spillover impact on EM central banks.
5. Rupee view
The Indian rupee touched a record low as it breached the 85.5 level against the US dollar in Dec-24. The depreciation pressures are a culmination of the following factors:
· Broad based strength in the US dollar on account of a relatively better economic position of US vis-à-vis its peers
· Elevated geopolitical tensions in the Middle East and uncertainty on the prospects of global trade (esp. in the backdrop of upcoming US presidential election in Nov-24) have supported the safe haven demand for the dollar.
· Meanwhile co-ordinated policy easing in China along with the target of Trump’s renewed tariff war is resulting in weakness in the Chinese yuan, which in turn is putting pressure on emerging market currencies.
· Foreign investment inflows into India have moderated on account of heightened geopolitical geoeconomic uncertainties.
o Net FDI inflow has dropped to USD 2.1 bn during Apr-Oct FY 2024-25 from USD 7.7 bn in the corresponding period in FY 2023-24.
o Net FPI inflow has moderated to USD 10.9 bn during Apr-Dec FY 2024-25 from USD 31.7 bn in the corresponding period in FY 2023-24
· Basis the RBI’s Real Effective Exchange Rate index (a trade weighted average exchange rate that adjusts for inflation differentials with the trading partner), the rupee is ~10% overvalued compared to the long period average. As such, any depreciation in the currency helps to correct for the inherent overvaluation.
Amidst an uncertain backdrop, it now appears that the USDINR could now face lower resistance in moving towards 86.0 levels by Mar-25
5. CYTD price change in key commodity groups and shipping cost

Cautious optimism on global trade; outlook on monetary policy and rupee
In this month, we focus on the outlook for global trade and its implications for India. With the Red Sea disturbance about to complete a full year, we take stock of trade activity along with a peak at maritime freight cost. This is followed by a quick assessment of US and India’s monetary policy along with the outlook on the Indian rupee.
1. Global trade to improve in 2025, but significant risks remain
Notwithstanding the elevated geopolitical uncertainty, global merchandise trade volume has expanded (as estimated by the CPB Netherlands) by 1.3% during Jan-Jul 2024 compared to an anaemic growth of 0.1% seen in the corresponding period in 2023. Bulk of this has come on the back of strong import demand from the UK and US along with strong export performance by China. Among major economies, Eurozone and to some extent Japan posted a disappointing performance on real merchandise trade activity in the first seven months of 2024.
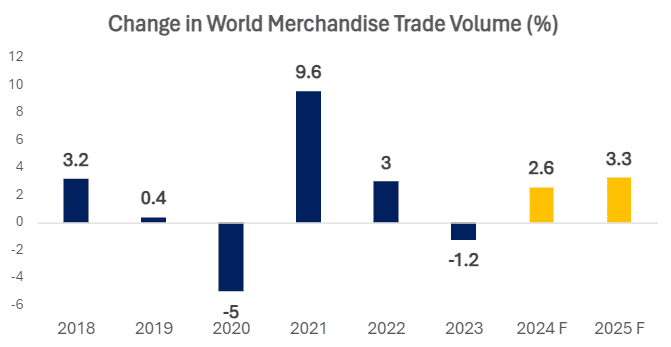
We note that the World Trade Organization has upped its forecast for growth in global merchandise trade volume by 10 bps to 2.7% in its bi-annual assessment of global trade. This would be the best performance in the post COVID phase, barring 2021 that saw an exceptionally high growth as unlocking of economies allowed pent-up trade activity to pass through.
For 2025, while the WTO revised lower its forecast for world trade volume growth by 30 bps to 3.0%, it nevertheless indicates improvement over the 2024 momentum.
Moderation in global inflationary pressure has allowed many central banks to ease monetary policy. This should support consumption/investment, which in turn would help in a gradual recovery of global trade. However, the WTO acknowledges that significant downside risks remain, including regional conflicts, geopolitical tensions and economic policy uncertainty.
Chart 1: After a contraction in 2023, global merchandise trade volume is expected to recover in 2024 and 2025
Source: WTO and QuantEco Research
From India’s perspective, the expectation of revival in global trade is comforting – after all, merchandise exports and services exports had a share of 12.4% and 9.6% in India’s GDP in FY 2023-24. We take a regional look at what could drive this revival from India’s perspective.
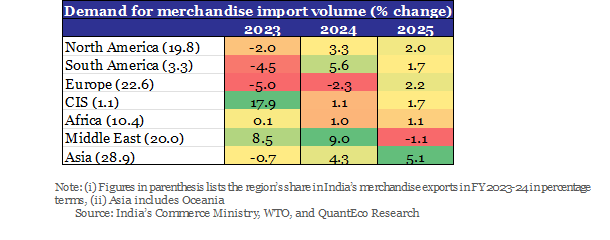
As per the WTO, growth in demand for imports on volume basis is expected to be the strongest for countries in Asia over 2024 and 2025. This is expected to be followed by countries in South America and North America. While the Middle East is expected to see strong demand in 2024, the same could peter out completely in 2025. Meanwhile, demand from Europe, CIS countries, and Africa is likely to remain subdued over 2024 as well as 2025.
Table 1: Regional heatmap depicting growth in volume of merchandise import demand
2. An update on the Red Sea crisis and shipping cost
It’s been almost one year since the Houthi movement started escalating with targeted attacks on ships crossing the Red Sea trading route (that is known to handle ~15% of global maritime trade). The attacks led many carriers to avoid the Red Sea route altogether, and opting for a detour with vessels going around the Cape of Good Hope in Africa. For most trade routes, rerouting via the Cape of Good Hope results in minimal delays, but Asia-Europe is an exception, experiencing additional travel time of 1-3 weeks compared to the more direct route via the Red Sea.
As per the current situation, as of Sep-24:
· Transit trade volume via the Bab-el-Mandeb Strait (a critical choke point in the Red Sea route that has seen concentration of attacks by the Houthis) was lower by 79.3% on annualized basis
· In contrast, the transit trade volume via the Cape of Good Hope (located at the southern tip of Africa) is up by 42.4% on annualized basis
Global maritime trade cost presents a mixed picture in 2024 so far. At one end, the Baltic Dry Index and the Baltic Tanker Index is down ~28% and ~23% in 2024 so far, the Baltic Container Index is up by a whopping ~170%. Although maritime freight volume carried by containers is about 13%, their share in the value of maritime trade is high at around 66%. Hence, although the sharp rise in container freight cost this year is unlikely to have a meaningful impact on the volume of maritime trade, it is bound to impact its overall cost.
The rise in freight costs can be attributed to several factors that include increased consumption demand, strikes in the transportation sector, shipping accidents, and extreme weather events. In recent months, the North American freight market has faced significant challenges such as a rail strike in Canada and the collapse of the Baltimore bridge. In last 6 months, China has faced disruptions in port activity on account of heavy fog and typhoons, while Malaysia and Singapore experienced delays due to heavy rainfall.
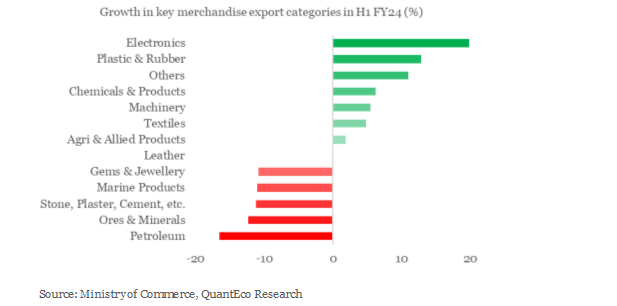
3. India’s export performance during the first half of FY 2024-25
As per preliminary estimates from the Ministry of Commerce, India’s merchandise exports grew at a tepid rate of 1.0% to USD 213 bn during Apr-Sep FY 2024-25 from USD 211 bn in the corresponding period in FY 2023-24. At a granular level:
· Top 5 items that recorded the fastest growth were Gold, Raw Silk, Silver, Aircraft/Spacecraft parts, and Computer hardware.
· Bottom 5 items in terms of growth were Wheat, Mollases, Processed Meat, Project Goods, and Wood products.
· The annualized share of Electronic items in India’s export basket currently stands at its highest level of 7.2%.
· The annualized share of Gems and jewellery items in India’s export basket currently stands at its lowest level of 7.1%.
Chart 2: There was wide variation in the performance of key export categories during Apr-Sep FY 2024-25
3. Monetary Policy Shift: Fed’s jumbo action to drive global rates lower
The US Federal Reserve finally joined the rate easing cycle with a jumbo sized 50 bps rate cut in Sep-24. More importantly, the Fed officials indicated at the possibility of another 50 bps rate before the end of 2024, followed by another 100 bps rate over the course of 2025. If realized, this will take the US monetary policy rate from its current range of 4.75-5.00% to 3.25-3.50% before the end of 2025.
With inflation moderation progressing at a gradual pace, the Fed now appears confident of meeting its inflation target in 2026. Meanwhile, although demand conditions appear relatively
healthy, gradual build-up of concerns has prompted the Fed to now start laying equal emphasis on its dual mandate of price stability and maximum employment.
The ongoing moderation in inflation pressures in 2024 over 2023 has prompted many central banks to start monetary easing. With the US Fed taking a bold and decisive step, other central banks might get influenced to replicate monetary policy easing actions in their respective economies. From India’s perspective, we note that the RBI shifted its monetary policy stance to ‘neutral’ from ‘withdrawal of accommodation’ in its Oct-24 policy review. While the shift in monetary policy stance happened without any change in the monetary policy rate (repo rate continues to remain at 6.50%), we believe it is a precursor for easing of interest rates in the near future. Depending upon the anticipated correction in domestic food prices and its overall impact on CPI inflation, market participants expect the RBI to deliver its first rate cut in either Dec-24 or Feb-25 policy review.
Chart 3: US monetary policy rate is set to decline further in 2025
4. Rupee view
The Indian rupee touched a record low as it breached the 84 level against the US dollar in Oct-24. The depreciation pressures are a culmination of the following factors:
· Broad based strength in the US dollar on account of a relatively better economic position of US vis-à-vis its peers
· Elevated geopolitical tensions in the Middle East and uncertainty on the prospects of global trade (esp. in the backdrop of upcoming US presidential election in Nov-24) have supported the safe haven demand for the dollar.
· Meanwhile co-ordinated policy easing in China is resulting in weakness in the Chinese yuan, which in turn is putting pressure on emerging market currencies
· Basis the RBI’s Real Effective Exchange Rate index (a trade weighted average exchange rate that adjusts for inflation differentials with the trading partner), the rupee is 7-8% overvalued compared to the long period average. As such, any depreciation in the currency helps to correct for the inherent overvaluation.
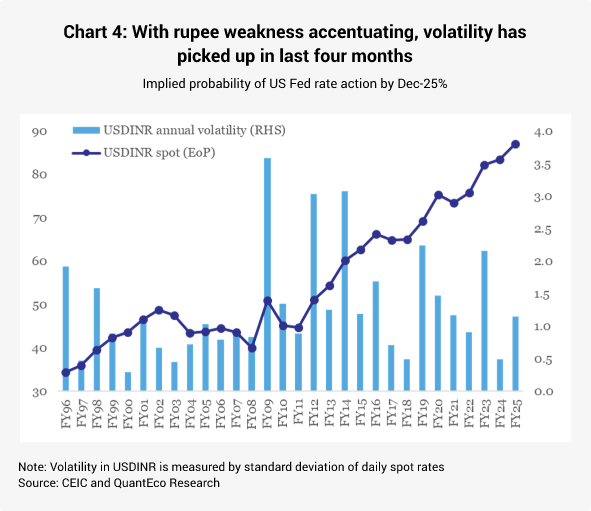
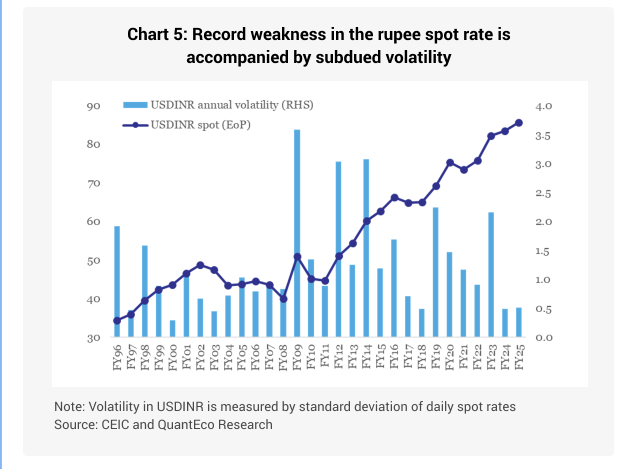
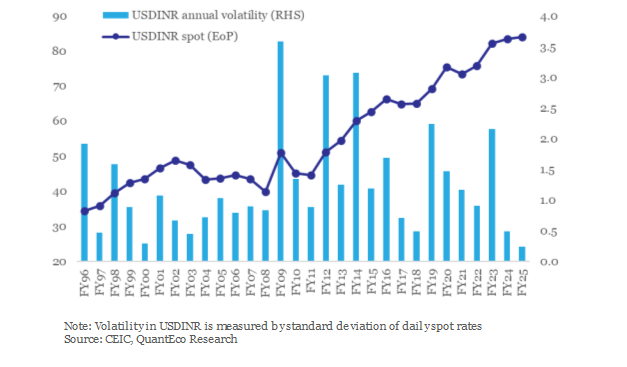
Despite the record weakness in the India rupee, the currency has seen extremely low levels of volatility. Relatively stable underlying macroeconomic balance characterized by high growth, moderate inflation, lower than trend trade deficit, correcting fiscal imbalances, and record high FX reserves bode well from the perspective of India’s global appeal and its currency stability.
Overall, we maintain our call of USDINR moving towards 84.5 levels by Mar-25.
Chart 4: Record weakness in the rupee spot rate is accompanied by record low volatility
5. CYTD price change in key commodity groups and shipping cost
FY25 Union Budget; outlook on monetary policy and rupee
The month of July has turned out to be important from two perspectives. On the domestic front, the central government presented the final budget for FY25, superseding the interim budget presented earlier in Feb-24. We parse through the signals to look at key takeaways along with implication for exporters. Meanwhile, expectations of commencement of monetary easing cycle (by the Fed and the RBI) and the presidential election season in the US are getting charged up. We take a quick look at what this holds for the rupee.
1. FY25 Union Budget prioritizes fiscal consolidation with micro boosters
On Jul 23rd, the central government presented the final Union Budget for 2024-25, superseding the interim budget presented earlier in Feb-24. Since the NDA retained the office after the general election outcome, fiscal policy continuity was maintained. Key highlights:
- Acceleration of fiscal consolidation
- The Finance Minister pruned the target for fiscal deficit to 4.9% of GDP from interim budget’s estimate of 5.1%. However, the incremental tightness in fiscal deficit will not be driven by pruning of expenditure. In fact, government’s expenditure bill is slated to increase to 14.8% of GDP, up from interim budget’s estimate of 14.6%. This has been possible on account of sharp increase in non-tax revenue with the RBI sharing record high dividend of Rs 2.1 lakh cr with the central government earlier this year.
- Prioritization of capital expenditure
- Allocation for capital expenditure is set to touch a 20-year high of 3.4% of GDP in 2024-25 vis-à-vis 3.2% in 2023-24. Bulk of the capex allocation in 2024-25 will be geared towards the transport (esp. roads and railways) and defence sectors.
Chart 1: While fiscal deficit is set to reach its post pandemic low in 2024-25, allocation for capex is set to create a record multi-decade high
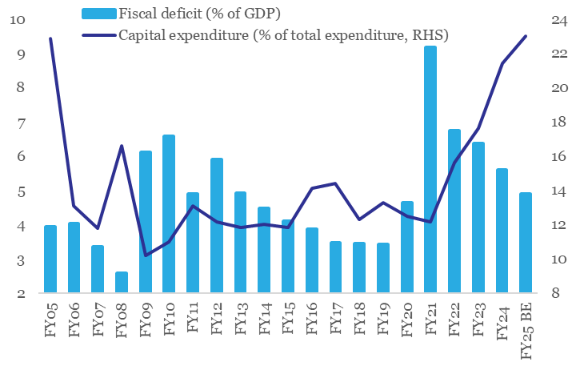
Source: Budget documents, CEIC, QuantEco Research
While that’s comforting from the perspective of overall macro stability and investor confidence, there were specific micro-boosters in the budget for supporting growth in targeted sectors like MSMEs.
- Availability of credit
- The TARUN category of MUDRA loans will now see an enhanced limit of Rs 20 lakhs from Rs 10 lakhs earlier.
- A new credit guarantee scheme, backed by the central government will be launched that will offer a guaranteed coverage up to Rs 100 cr per applicant.
- To prevent MSME loans classified as SMA accounts by the banks, the government will provide additional credit support from a credit guarantee fund to prevent such loans from slipping into NPAs.
- Over the next 3-years, SIDBI has been mandated to open 24 new branches, extending its services to 168 of the 242 major MSME clusters.
- Public sector banks will now build in-house capability for assessment of MSME credit instead of relying on external assessment.
- Financial stability and ease of operations
- The turnover threshold for buyers on the TReDS (Trade Receivables Discounting System) platform will be reduced from Rs 500 cr to Rs 250 cr, allowing 22 additional PSUs (public sector undertakings) and 7000 more companies to join the platform.
- Building infrastructure ecosystem
- The government will establish E-Commerce Export Hubs through public-private partnerships (PPPs). These hubs will provide a range of trade and export-related services under one roof, enabling MSMEs and traditional artisans to market their products internationally.
- The budget will provide financial support for setting up 50 multi-product food irradiation units and creating 100 NABL-accredited laboratories for quality, and safety testing units.
Chart 2: Although MSME ministry’s expenditure is set to moderate a tad, it remains significantly higher than its pre COVID levels
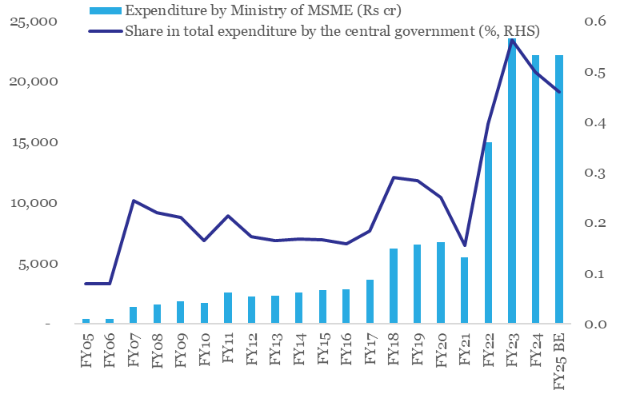
Source: Budget documents, CEIC, QuantEco Research
The measures outlined above will immensely benefit most exporters. In addition, the exporters would also gain from the announced reduction in custom duties (items illustrated in Table 1 below), that will help to boost cost competitiveness.
Table 1: Customs duty cuts in FY25 Union Budget will support domestic manufacturing, promote export competitiveness, and simplify taxation
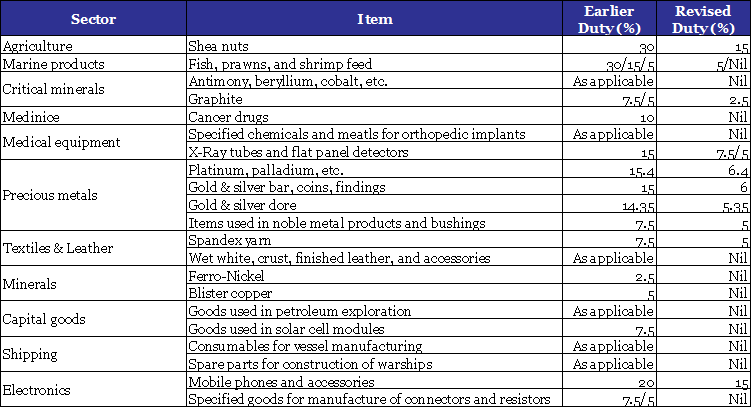
Source: Budget documents, QuantEco Research
2. Monetary Policy: Moving closer to the beginning of the rate easing cycle
Along expected lines, the US Federal Reserve once again pushed back monetary easing expectations at its Jun-24 policy review. As per the latest projections by the Fed members, there is likely to be one rate cut before the end of 2024, down from the projection of two rate cuts predicted earlier in Mar-24.
However, with recent US economic data turning out to be softer than anticipated, market participants have priced in at least two rate cuts from the Fed (with the first cut in Sep-24) before the end of 2024. As such, the 1-year US Treasury bill rate has dropped by 30 bps since end Jun-24 to 4.79% currently.
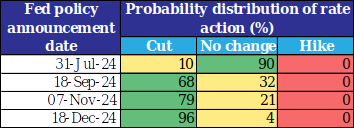
In case of India, we believe the RBI will follow its own course and wait for food price volatility to subside after the completion of the 2024 south-west monsoon season (in which the Indian Meteorological Department projects a 6% surplus rainfall). A favorable monsoon outturn and range-bound commodity prices will enable to start easing monetary policy from Oct-Dec 2024, with likelihood of a cumulative 50 bps rate cut by Mar-25.
Table 2: Market participants expect at least 2 rate cuts from the US Fed in 2024
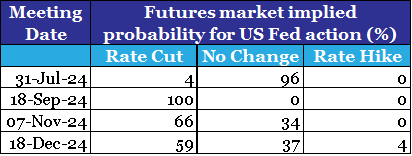
Source: CME, QuantEco Research
3. Rupee view
Notwithstanding gyrations in the global currency markets in recent months, the Indian rupee posted a stable performance in the financial year 2024-25 so far. With domestic general elections and the Union Budget pointing towards policy continuity, we expect the underlying macro-stability anchor for the rupee to remain intact.
From a flow perspective, INR is likely to remain in a comfortable zone:
- India’s current account deficit narrowed to 0.7% of GDP in FY24 (the lowest in the post COVID phase) from 2.0% in FY23. After adjusting for capital flows, the accompanying balance of payment registered a strong surplus of USD 64 bn in FY24.
- For FY25, we expect current account deficit to show a mild increase to 0.9% of GDP (though much lower than the long-term trend of 1.5%). However, expectation of recovery in FDI flows along with healthy FPI flows (amidst India’s inclusion in global bond indices) should help to generate a healthy BoP surplus of USD 50 bn.
Chart 3: Rupee has been one of the most stable currencies
Note: FYTD change is between 26-Jul-24 & 1-Apr-24; DM/EM imply Developed and Emerging Markets respectively
Source: CEIC, QuantEco Research
Meanwhile, global factors like uncertainty around the US presidential elections (to be held in Nov-24), geopolitical risks in the Middle East, and build-up of depreciation pressure on the Chinese yuan could potentially result in weakness for rupee. Overall, rupee’s 8-9% overvaluation, and RBI’s inclination for reserve accumulation would tilt the balance in favor of a mild depreciation. We maintain our call of USDINR moving towards 84.50 levels by Mar-25 vs. FY24 close of 83.43.
4. CYTD price change in key commodity groups and shipping cost
Note: (i) Price change is between Jul 26, 2024 and Dec 31, 2023; (ii) Oil price is represented by Brent; (iii) rounded off figures represented, (iv) While BDI has declined on CYTD basis, other shipping cost indicators like the VHBS ConTex Index has risen 163% on CYTD basis.
Data: CEIC, QuantEco Research

Global trade fragmentation; outlook on monetary policy and rupee
In this month, we look at the fragmentation of global merchandise trade, which would somewhat inhibit the extent of anticipated recovery in 2024. This is followed by a quick assessment of US and India’s monetary policy along with the outlook on the Indian rupee.
1. Global trade fragmentation
Notwithstanding the expectation of a moderate recovery in world merchandise trade in 2024 (which we elaborated upon in the May-24 newsletter), global trade activity has been continuously facing geopolitical headwinds. This trend that became noticeable with the start of US-China trade war in 2018 and picked up considerable momentum in the post COVID period, with many countries displaying protectionist tendencies. The calendar year 2023 saw a record number of harmful trade policy interventions by countries.
Chart 1: Trade protectionism has seen a sharp rise in last few years
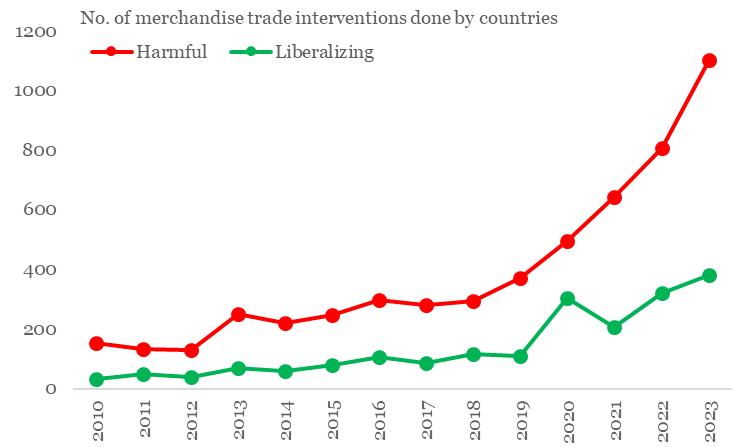
Source: GTA, QuantEco Research
Since 2023, countries have used several motives to intervene on the merchandise trade front. The most common reasons cited are:
- Strategic competitiveness
- Climate change mitigation
- Resilience/ Security of supplies
- Geopolitical concern and national security
These trade policy interventions have given rise to both winners and losers across sectors. The table below lists Top 5 sectors under each category (since 2023).
| Sectors affected by liberalising interventions | No. of interventions since 2023 | Sectors affected by harmful interventions | No. of interventions since 2023 |
| Machinery & parts | 124 | Iron & steel and its products | 533 |
| Cereals | 70 | Cereals | 304 |
| Vegetable oils | 70 | Fabricated metal products | 276 |
| Sugar & molasses | 54 | Unfinished products of copper, nickel, aluminium, lead, zinc, or tin | 258 |
| Grain mill products | 52 | Glass and its products | 247 |
Source: GTA, QuantEco Research
From 2024 perspective, the outlook on world merchandise trade (as enumerated by multilateral agencies like the IMF and the WTO) is moderately encouraging. Exporters surveyed by The Economist expect 2.3% increase in export volumes (goods + services) in 2024 compared to a subdued growth of 0.7% in 2023. Having said, the exporters echoed the uncertainty of the current global trade environment by highlighting veracious limitations for expansion (Top 10 limitations are illustrated below in Chart 2).
Chart 2: What’s limiting exporters’ ability to expand?
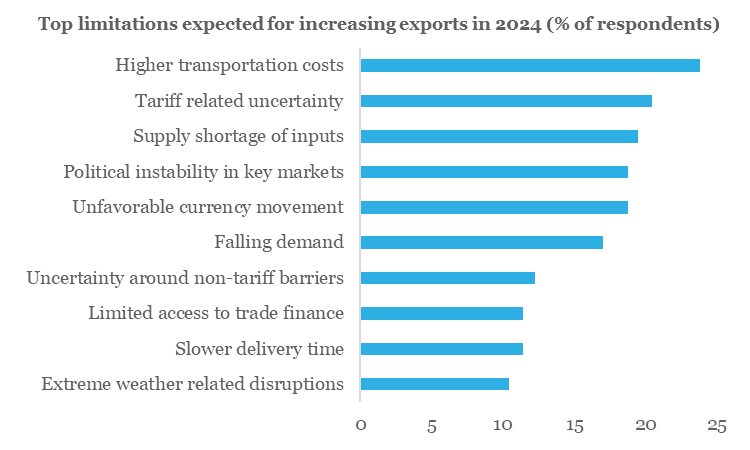
Source: Economist, QuantEco Research
Interestingly, as a response to ongoing geopolitical shocks and in preparation for further escalation of geopolitical tensions that disrupt global trade, strategies like ‘friendshoring’ and the creation of dual supply chains are gaining prominence. The ‘China+1’ strategy is becoming more prevalent as businesses seek to diversify and reduce their dependency on a single region.
Chart 3: How are geopolitical events impacting global trade and supply-chains?
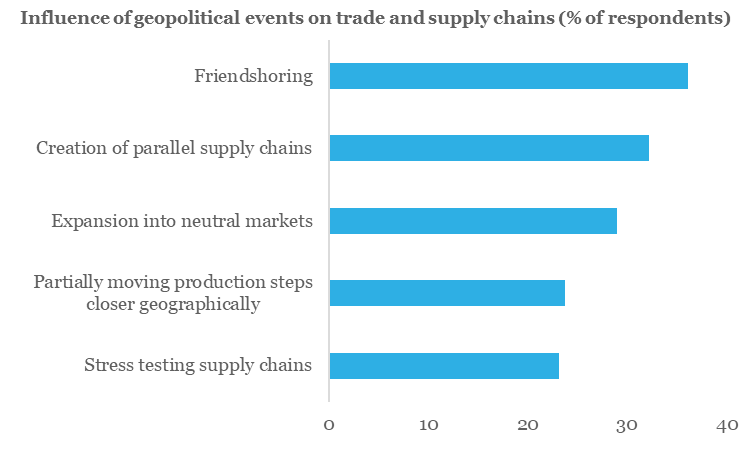
Source: Economist, QuantEco Research
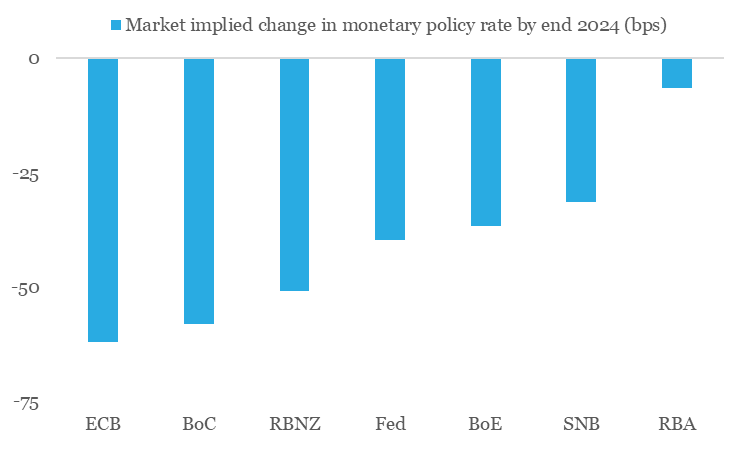
2. Monetary Policy: Easing by the US Fed to get delayed
Along expected lines, the US Federal Reserve once again pushed back monetary easing expectations at its Jun-24 policy review. As per the latest projections by the Fed members, there is likely to be one rate cut before the end of 2024, down from the projection of two rate cuts predicted earlier in Mar-24.
While the pushback in the anticipated rate easing in US could have an impact on other emerging market economies, few central banks (like the central banks in Eurozone, Canada, Switzerland, Sweden, Brazil, Mexico, etc.) have taken the lead in kickstarting their monetary easing cycle. This highlights the importance of domestic macroeconomic conditions guiding central bank actions.
In case of India, we believe the RBI will also follow its own course and wait for food price volatility to subside after the completion of the 2024 south-west monsoon season (in which the Indian Meteorological Department projects a 6% surplus rainfall). A favorable monsoon outturn and range-bound commodity prices will enable to start easing monetary policy from Oct-24 onwards, with likelihood of a cumulative 50 bps rate cut by Mar-25.
Chart 4: Market participants expect 1-2 rate cuts from the US Fed in 2024
Source: Refinitiv, QuantEco Research
3. Rupee view
Notwithstanding gyrations in the global currency markets in last 2 months, the Indian rupee kickstarted the new financial year 2024-25 on a firm footing vs. the USD. With election uncertainty now behind, investors can now look forward to political and policy continuity. We expect the new government to continue prioritizing macroeconomic stability with focus on inclusive development.
From a flow perspective, INR is likely to remain in a comfortable zone:
- India’s current account deficit narrowed to 0.7% of GDP in FY24 (the lowest in the post COVID phase) from 2.0% in FY23. After adjusting for capital flows, the accompanying balance of payment registered a strong surplus of USD 64 bn in FY24.
- For FY25, we expect current account deficit to show a mild increase to 0.9% of GDP (though much lower than the long-term trend of 1.5%). However, expectation of recovery in FDI flows along with healthy FPI flows (amidst India’s inclusion in global bond indices) should help to generate a healthy BoP surplus of USD 50 bn.
Chart 5: India’s FY24 current account deficit was narrower than its long term trend; likely to remain so in FY25
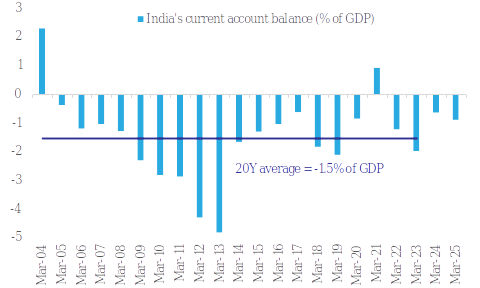
Source: CEIC, QuantEco Research
Meanwhile, global factors like uncertainty around the US monetary policy trajectory and geopolitical risks could result in bouts of depreciation pressure. Overall, INR’s 6-7% overvaluation, and RBI’s penchant for reserve accumulation would tilt the balance in favor of a mild depreciation. We maintain our call of USDINR moving towards 84.50 levels by Mar-25 vs. FY24 close of 83.43.
5. CYTD price change in key commodity groups and shipping cost
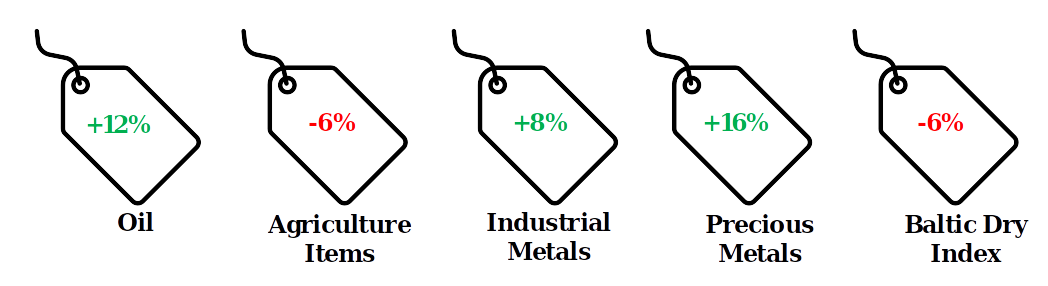
Note: (i) Price change is between Jun 24, 2024 and Dec 31, 2023; (ii) Oil price is represented by Brent; (iii) Agriculture Items, Industrial Metals, and Precious Metals are represented by respective Bloomberg Commodity indices; (iv) rounded off figures represented.
Data: Refinitiv, QuantEco Research

Diminishing role of trade credit; impact of Red Sea disturbance; outlook on monetary policy and rupee
In this month, we look at the performance of export credit in FY24 and its diminishing role. We extend our investigation into the Red Sea impact on India’s trade to pick up early signals. This is followed by a quick assessment of US and India’s monetary policy along with the outlook on the Indian rupee.
1. Diminishing role of export credit
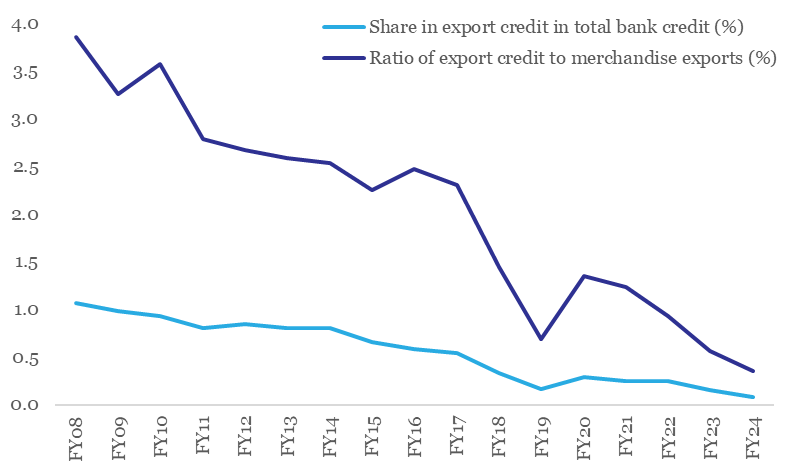
Export credit registered its second consecutive contraction (-30% and -37% in 2022-23 and 2023-24 respectively), with the magnitude of outstanding credit slipping to Rs 12,900 cr for the year ending Mar-24. In value terms, this is the lowest level of export credit in last 17-years. More importantly, we note that the importance of export credit has been slipping over the years:
- In 2023-24, the share of export credit in total bank credit slipped to a record low level of 0.08%.
- The ratio of export credit to merchandise credit has fallen from its peak of 3.8% in 2007-08 to 0.4% in 2023-24.
Chart 1: Role of export credit in trade financing has diminished considerably
Source: RBI, CEIC, QuantEco Research
At a cursory level, we note that while India’s market share in global exports has improved since 2007-08 to its record high levels of 1.8-1.9% in 2023-24, the economy’s export intensity (captured by the ratio of merchandise exports to GDP) has moderated to 12.2% in 2023-24, which is marginally below its pre COVID levels of 12.5%, but significantly lower than its peak performance of 17.0% in 2011-12. The trend of improving market share coupled with reducing export intensity (on the merchandise side) is intriguing and needs to be researched and investigated in detail by the policymakers.
A reduction in export intensity at an economy wide level translates into a lower requirement for export credit. Having said, it is also possible that alternatives to bank-based export credit are now readily being availed by exporters.
Chart 2: India’s export intensity has reduced even though its’s export market share has improved
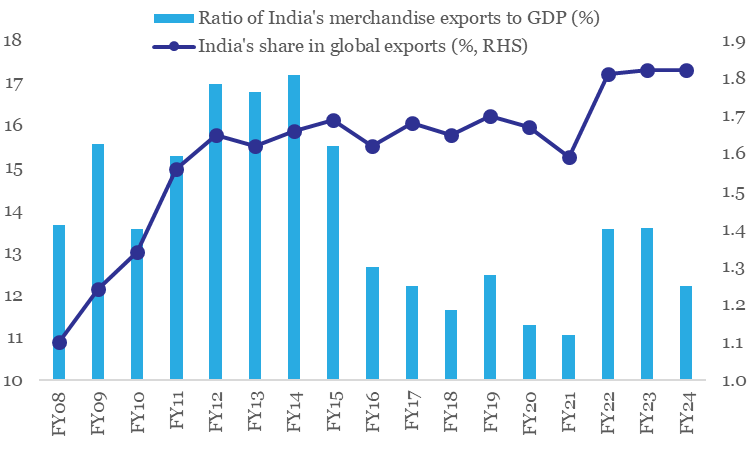
Note: Data for FY24 refers to the period Apr-Dec 2023
Source: RBI, WTO, CEIC, QuantEco Research
2. Is there any evidence of Red Sea impact on India’s merchandise exports?
Notwithstanding the ongoing disruption to global merchandise trade on account of geopolitical conflict in the Middle East region, India’s export performance has held up with annualized growth in merchandise exports improving to 2.9% in Jan-Mar FY24 over Oct-Dec FY24. This could be reflective of the impact of higher international commodity prices along with resilience in global demand (highlighted in our last month’s issue).
Since the start of the Red Sea disturbance in Dec-23, the underlying sequential momentum in India’s merchandise trade over Jan-Apr 2024 period has shown a mixed trend, with 2 out of 4 months exceeding the seasonal sequential benchmark, and vice versa (see table below). This points towards lack of any conclusive evidence of an adverse impact of recent geopolitical disturbances.
Table 1: Headline exports does not show any conclusive evidence of sub-par performance post the Red Sea disturbance
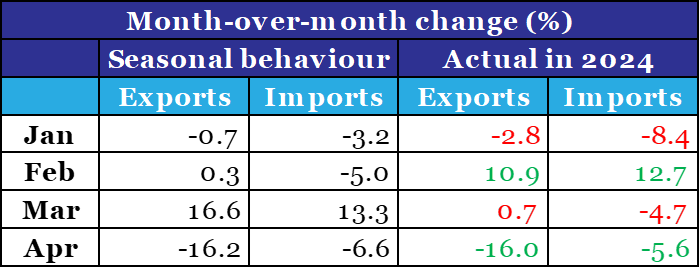
Note: (i) Month-over-month change is on the $ value of exports; (ii) Seasonal behaviour represents last 30Y median
Source: India’s Commerce Ministry, CEIC, QuantEco Research
A cursory look at India’s export destinations that exhibited weakness in the post Red Sea period (defined as more than 10 percentage point slide in annualized export performance in Jan-Mar FY24 over Oct-Dec FY24) indicates no conclusive evidence of systematic disruption – the geographical distribution of such export destination appears to be well spread.
Chart 3: Decline in demand India’s exports post the Red Sea disturbance shows a mixed geographical distribution
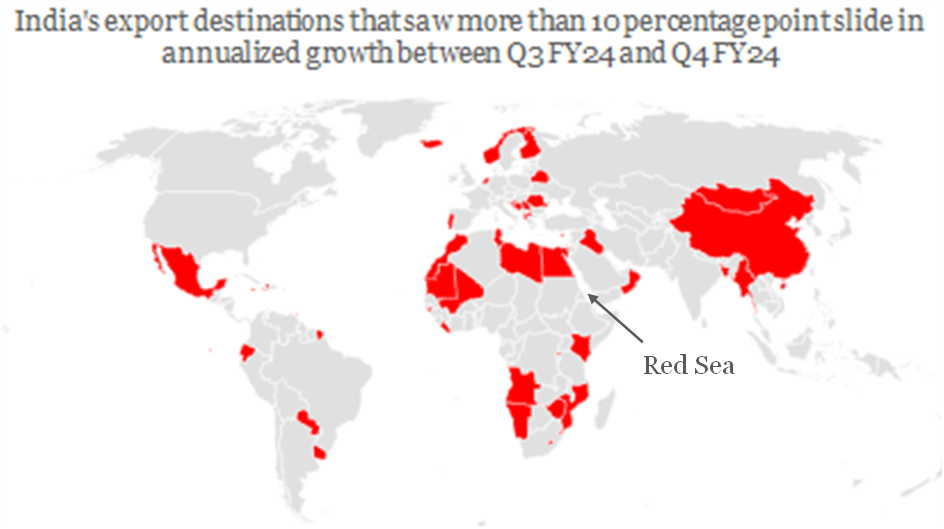
Source: India’s Commerce Ministry, CEIC, QuantEco Research
Having said, we note that the threat of Red Sea disruption remains alive. As per the FIEO (Federation of Indian Exporters’ Organisations), “delays and higher costs of shipping can lead to more order cancellations and hurt India’s competitive edge in global markets”. We would continue to track data in this space to arrive at early signals.
Table 1: Europe-Asia trade is the worst affected on account of Red Sea disturbance
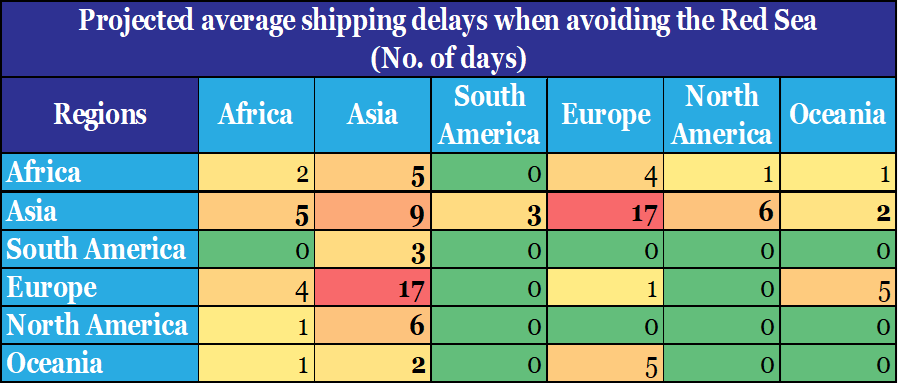
Source: WTO, QuantEco Research
3. Monetary Policy: Easing by the US Fed to get delayed
Market expectations regarding Fed’s monetary policy trajectory remains on tenterhooks and is seen to be swaying with every notable surprise in key US economic data. Continued resilience in US activity data coupled with stickiness in inflation has already led to a significant pruning of market expectations of rate cuts from the Fed – the current pricing by futures market suggests likelihood of 1-2 rate cuts before the end of 2024, down from the expectation of 5-6 rate cuts at the beginning of the year.
This pushback in the anticipated rate easing in US could have an impact on other emerging market economies, like India. A surplus rainfall projected for the 2024 south-west monsoon season is preceded by (ongoing) severe heatwave conditions across India in Apr-Jun, that could cause some volatility in food price pressures in the near term. We expect the RBI to start easing monetary policy from Oct-24 onwards, with likelihood of a cumulative 50 bps rate cut by Mar-25.
Chart 4: Market participants expect 1-2 rate cuts from the US Fed in 2024
Source: Refinitiv, QuantEco Research
4. Rupee view
Notwithstanding gyrations in the global currency markets in last 1-2 months, the Indian rupee kickstarted the new financial year 2024-25 on a firm footing vs. the USD. Although the general election cycle is currently underway, we believe the overall policy backdrop of macroeconomic stability is likely to prevail in near-to-medium term. While this would continue to provide a stable underpinning to the INR, global factors like uncertainty around the US monetary policy trajectory and geopolitical risks could result in bouts of depreciation pressure. Overall, INR’s 6-7% overvaluation, and RBI’s penchant for reserve accumulation would tilt the balance in favor of a mild depreciation. We maintain our call of USDINR moving towards 84.50 levels by Mar-25 vs. FY24 close of 83.43.
5. CYTD price change in key commodity groups and shipping cost

Note: (i) Price change is between May 21, 2024 and Dec 31, 2023; (ii) Oil price is represented by Brent; (iii) Agriculture Items, Industrial Metals, and Precious Metals are represented by respective Bloomberg Commodity indices; (iv) rounded off figures represented.
Data: Refinitiv, QuantEco Research

Cautious optimism on global trade; outlook on monetary policy and rupee
In this month, we focus on the outlook for global trade and its implications for India. This is followed by a quick assessment of US and India’s monetary policy along with the outlook on the Indian rupee.
1. Global trade to rebound in 2024, but risks remain
First, the good news. As per the World Trade Organization’s Global Trade Outlook and Statistics report (Apr-24), compared to a contraction of 1.2% in 2023, world merchandise trade volume is projected to expand by 2.6% in 2024 and further by 3.3% in 2025. As per the agency, easing of global inflationary pressures and the concomitant increase in household incomes should help support demand for merchandise trade in 2024 and 2025.
Chart 1: After a contraction in 2023, global merchandise trade volume is expected to recover in 2024 and 2025
Note: Values for 2024 and 2025 are forecasts by the WTO
Source: WTO, QuantEco Research
A similar portrayal is also done by the International Monetary Fund, in their World Economic Outlook presented in Apr-24. As per their forecasts, volume of global trade (goods+services) is set to expand by 3.0% and 3.3% in 2024 and 2025 respectively after a subdued growth of 0.3% in 2023.
From India’s perspective, the expectation of revival in global trade is comforting – after all, merchandise exports and services exports had a share of 12.5% and 9.7% in India’s GDP in CY2023. We take a regional look at what could drive this revival from India’s perspective.
As per the WTO, growth in demand for imports on volume basis is expected to be the strongest for countries in Asia over 2024 and 2025. This is expected to be followed by countries in South America and Africa. Demand for imports is likely to be the weakest from the CIS group of countries in 2024 and 2025, followed by the European and Middle East countries.
Table 1: Regional heatmap depicting growth in volume of merchandise import demand

Note: (i) Figures in parenthesis lists the region’s share in India’s merchandise exports in 2023 in percentage terms, (ii) Asia includes Oceania
Source: India’s Commerce Ministry, WTO, QuantEco Research
Notwithstanding the optimistic outlook for global trade, there are unpredictable downside risks due to current geopolitical conflicts (esp. in the Middle East/ West Asia region) and trade policy uncertainty (esp. involving US and China). Notably, while the trade volume forecasts by the WTO and the IMF for 2024 suggest recovery, both estimates were marked down by 70 bps and 50 bps respectively vis-à-vis their previous forecast levels provided in Oct-23.
2. A quick round-up of India’s export performance in FY 2023-24
As per preliminary estimates from the Ministry of Commerce, India’s merchandise exports contracted by 3.1% to USD 437 bn in FY 2023-24 from USD 451 bn in FY 2022-23. At a granular level, there were wide variations in category wise export performance.
- Electronic items grew at the fastest pace, with its annualized share in the total export basket scaling an all-time high of 6.7%.
- Stone, Plaster, Cement, etc. did well as a category, which helped its annualized share in the total export basket touch 1.0%.
- Meanwhile, Leather, Gems & Jewellery, Plastic & Rubber, and Textiles saw their share in the total export basket dip to an all-time low of 1.0%, 7.5%, 1.8%, and 7.4% respectively.
- With respect to incremental change in sectoral shares, while Electronics saw the biggest increase, Petroleum products saw the largest decline.
Chart 2: Despite contraction at an aggregate level, there was wide variation in the performance of key export categories in FY 2023-24

Source: Ministry of Commerce, QuantEco Research
2. Monetary Policy Shift: Easing by the US Fed to get delayed
Since our last update in Mar-24, there has been a considerable reassessment of market expectation with respect to the monetary policy trajectory in the US. Continued resilience in US economic data has started to cast doubt whether the entire cumulative rate cut of 225 bps as indicated by the latest Fed official’s projection for 2024-2026 period would be needed to glide Core PCE inflation towards its target of 2.0% by 2026.
The recent hardening of global crude oil prices has further dampened the outlook for near term inflation prospects.
As such, market participants have scaled back their expectation of imminent monetary easing by the US Fed. The futures market currently indicates the probability of just under two round rate cuts before the end of CY 2024. This is lower than the expectation of at least three round of rate cuts for 2024, just about a month back. We now expect the Fed to begin cutting rates from Sep-24 onwards, with possibility of up to 75 bps cumulative rate cut by Mar-25.
This pushback in the anticipated rate easing in US could have an impact on other emerging market economies, like India. A surplus rainfall projected for the 2024 south-west monsoon season will be preceded by (ongoing) severe heatwave conditions across India in Apr-Jun, that will potentially stoke food price pressures in the near term. As such, we now expect the RBI to start easing monetary policy from Oct-24 onwards, with likelihood of a cumulative 50 bps rate cut by Mar-25.
3. Rupee view
The Indian rupee clocked a mild depreciation of 1.5% against the US dollar in FY 2023-24. This was accompanied by subdued volatility, both from a historical perspective, as well as compared to key currency peers across the DM (developed markets) and EM (emerging markets) FX space. Our baseline view for FY25 mirrors the outturn in FY24, i.e., the likelihood of a mild depreciation accompanied by subdued volatility.
In recent weeks, global factors have turned adverse on the margin:
- Resilience in US economic data has pushed back expectations of monetary policy easing by the US Fed, as discussed above. This has provided a leg up to the US dollar, which in turn has weighed upon emerging market currencies, including the Indian rupee.
- Escalation of geopolitical conflict in the Middle East/ West Asia region is providing an upside to the US dollar (as it enjoys a safe haven status) as well as crude oil prices (this could potentially weigh upon the rupee as oil accounts for ~40% of India’s merchandise trade deficit).
These risks could get partly offset on account of resilience in India’s underlying macro-stability parameters, our forecast of a Balance of Payments surplus in FY 2024-25, and expectation of a recovery in global trade, as discussed above.
Overall, we maintain our call of USDINR moving towards 84.5 levels by Mar-25.
Chart 3: While total trade deficit remains moderate, portfolio inflows have lost momentum in recent weeks
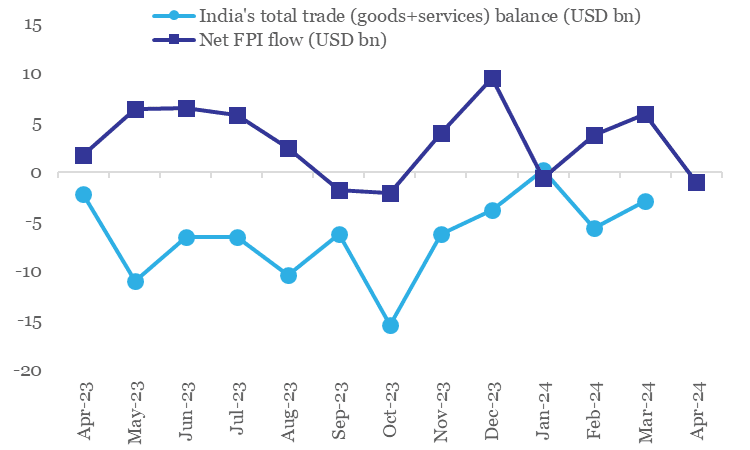
Source: CEIC, QuantEco Research
Note: FPI flow data for Apr-24 is until 21st
4. CYTD price change in key commodity groups and shipping cost
Note: (i) Price change is between Apr 19, 2024 and Dec 31, 2023; (ii) Oil price is represented by Brent; (iii) Agriculture Items, Industrial Metals, and Precious Metals are represented by respective Bloomberg Commodity indices; (iv) rounded off figures represented.
Data: Refinitiv, QuantEco Research

India`s trade negotiations; outlook on monetary policy and rupee
Last few weeks saw hectic activity in the sphere of policies with respect to global trade. We take a cursory look at the key developments. This is followed by a quick assessment of US and India’s monetary policy along with the outlook on the Indian rupee.
1. Implications of recent trade related policy developments
During the last few weeks, India participated in three global trade related policy developments, viz., WTO’s 13th Ministerial Conference, India-EFTA Trade and Economic Partnership Agreement, and Indo-Pacific Economic Framework for Prosperity. Below, we highlight key takeaways from each:
WTO’s 13th Ministerial Conference (MC13)
The WTO’s MC13 meet that concluded on Mar 2nd with participation from 166 trade ministers saw the acceptance of the Abu Dhabi Declaration, which turned out to be rather underwhelming. Geopolitical uncertainty (like wars involving Russia-Ukraine and Israel-Hamas), slowdown in few economies, and pending elections in several countries in 2024 posed headwinds, with the MC13 failing to conclude several areas of negotiations. To highlight, deals on fisheries and agriculture remains open while consensus on WTO’s dispute settlement architecture is yet to be formed. However, negotiations on the extension of the e-commerce moratorium offered a silver lining.
From India’s perspective, we note that:
- The current stance on MSP (Minimum Support Price) and PSH (Public Stock Holding) was maintained with no commitment towards reduction in farm subsidy unless WTO delivers a permanent solution on PSH for all members and protects the treaty-embedded Special and Differential Treatment provision in the Agreement on Agriculture.
- The stance on fisheries was maintained as no restrictions within the EEZs (Exclusive Economic Zones) for preserving livelihood and food security.
- India opposed duty-free digital transmission to safeguard against potential revenue losses amidst the need for supervising growing digital trade.
India-EFTA Trade and Economic Partnership Agreement
After over a decade of negotiations, India signed the Trade and Economic Partnership Agreement with EFTA countries (comprising Switzerland, Iceland, Norway & Liechtenstein) on Mar 10th. The TEPA with EFTA countries is unique as:
- This is India’s first FTA with four developed nations
- For the first time in history of FTAs, binding commitment of USD 100 bn FDI and 1 mn direct jobs in the next 15 years has been given by the EFTA countries
The agreement comprises of 14 chapters with main focus on market access related to goods, rules of origin, trade facilitation, trade remedies, sanitary and phytosanitary measures, technical barriers to trade, investment promotion, market access on services, intellectual property rights, trade and sustainable development and other legal and horizontal provisions.
Under this deal, India will reduce most import tariffs on processed food and beverages along with electrical machinery items, pharmaceutical products, and medical devices (gold imports will not receive any tariff concession) from the four countries in return for investments over 15 years. The investments are expected to be made across a range of industries, including pharmaceuticals, machinery, and manufacturing.
As per India’s Ministry of Commerce, the FTA will provide a window to Indian exporters for improved access to the European market. In addition, the FTA aims to provide Mutual Recognition Agreements in professional services (such as Nursing, Chartered Accountancy, and Architecture) for cross-border exchanges and collaborations while also boosting agreements in services like IT, Business, Culture, and Education.
Indo-Pacific Economic Framework for Prosperity (IPEFP)
India along with its other IPEFP partners had their first ministerial meeting on Mar 14th. IPEFP was launched in May-22, bringing together 14 regional partners (Australia, Brunei, Fiji, India, Indonesia, Japan, Korea, Malaysia, New Zealand, Philippines, Singapore, Thailand, US, and Vietnam) – in a new model of economic cooperation. While the Framework is not a trade agreement/treaty, it nevertheless seeks to advance cooperation across four key pillars of Trade, Supply Chains, Clean Economy, and Fair Economy.
India has signed a supply chain resilience agreement with the US and 12 other members of the IPEFP to reduce its dependence on China. It has so far stayed away from the trade pillar of the Framework.
Table 1: India currently has 18 key trade agreements on bilateral and multilateral basis
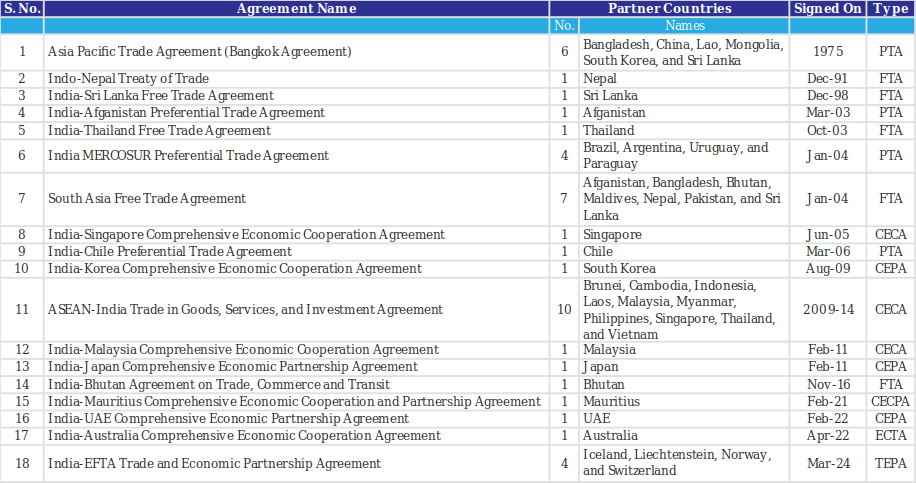
Note: There is often a lag between signing of a trade agreement and its implementation
Source: India’s Commerce Ministry, PIB, US International Trade Administration, Media reports, QuantEco Research
Table 2: India currently has 10 key ongoing trade negotiations on bilateral and multilateral basis
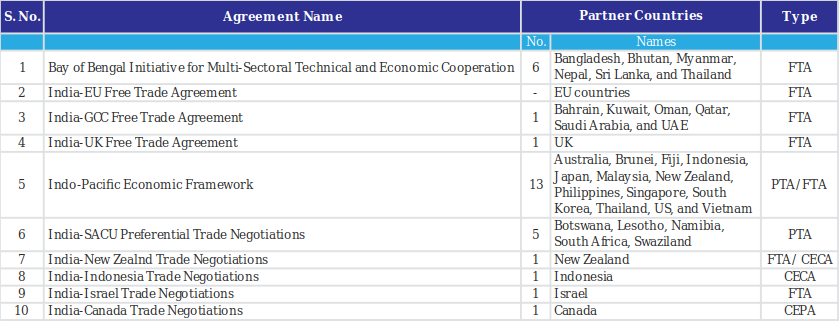
Note: As per media reports, negotiations with EU and UK are at an advanced stage
Source: India’s Commerce Ministry, PIB, QuantEco Research
2. Outlook on monetary policy
Along expected lines, the US Fed left its policy rate unchanged (in the 5.25-5.50% range) at its policy review on Mar 20, 2024. However, there were few noticeable changes in the FOMC (Federal Open Market Committee) projections:
- The outlook for growth saw an upgrade across 2024-2026. The most sizeable upward revision was seen in case of 2024, with GDP growth now projected at 2.1% vs. the earlier projection of 1.4% in Dec-23.
- The forecast for unemployment rate in 2024 and 2026 saw a minor downward revision to 4.0% from 4.1% projected earlier in Dec-23.
- Forecast for Core PCE inflation for 2024 saw an upward revision to 2.6% from 2.4% projected earlier in Dec-23.
- Last, but not the least, the median projection for fed funds rate for 2024 stood unchanged at 4.6%. This maintains the likelihood of 75 bps cumulative rate cut from the Fed before the end of 2024. In contrast, the projection for fed funds rate for 2025 and 2026 saw an upward revision to 3.9% and 3.1% from its earlier projection of 3.6% and 2.9% respectively in Dec-23.
Market pricing of US interest rate as per the futures market is currently in sync with the latest set of FOMC projections. We maintain our expectation of the first rate cut from the US Fed to begin from Jun-24 onwards.
With this as a backdrop, other key central banks could also begin their rate easing cycle with a lag (among developed countries, the Swiss National Bank (SNB) has in fact taken the lead, by announcing its first rate cut in Mar-24). In case of India, as CPI inflation starts providing durable comfort in the coming quarters, we expect the RBI to start its monetary easing cycle. With government recently announcing a series of fuel price cuts (Rs 100 per cylinder on LPG, Rs 2.1 per litre on diesel, and Rs 2.0 per litre on petrol), the RBI’s FY25 CPI inflation estimate of 4.5% could see some downside adjustment. As such, we now bring forward our expectation of the first rate cut from the RBI to Aug-24 from Oct-24 earlier, while maintaining the likelihood of 75 bps cumulative rate cut by Mar-25.
Table 3: In last 3-months, there has been an increase in Fed’s optimism with respect to the US economy
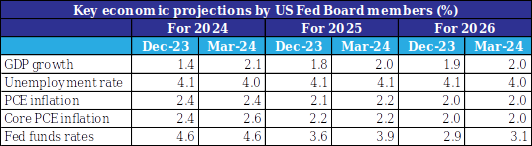
Source: Federal Reserve, QuantEco Research
3. Rupee view
After three consecutive months of mild appreciation, INR has reversed direction, and is currently trading 0.6% weaker against the USD in the month of Mar-24 so far. While INR was behaving in line with its favorable financial year-end seasonality and had strengthened somewhat in the first 2-3 weeks of Mar-24 (touching 82.75 on Mar 11th vs. 82.91 on Feb 29th), the reversal happened post the US Fed policy outcome, and more importantly after the SNB’s surprise rate cut, dilution of Bank of England’s hawkishness, and market expectations of a rate cut from the People’s Bank of China. While the USD appears to be on a rather neutral turf post the Mar-24 FOMC meet, expectation of monetary easing is weighing upon CNY, which in turn is adversely impacting other emerging market currencies, including the INR.
While we still believe that INR will be supported by favorable financial year-end trade seasonality along with healthy portfolio inflows (India has received USD 5.8 bn FPI inflow in Mar-24 so far), last few days of price action in the global currency market has added upside risk to our Mar-24 INR call of 82.5.
Having said so, we do maintain our medium-term view of a mild depreciation in INR, with likelihood of 84.5-85.0 by Mar-25. RBI’s proactive FX intervention should continue to remain a key source of suppression in INR volatility.
Chart 1: In recent months, INR has found support from narrowing of total trade deficit along with healthy portfolio inflows
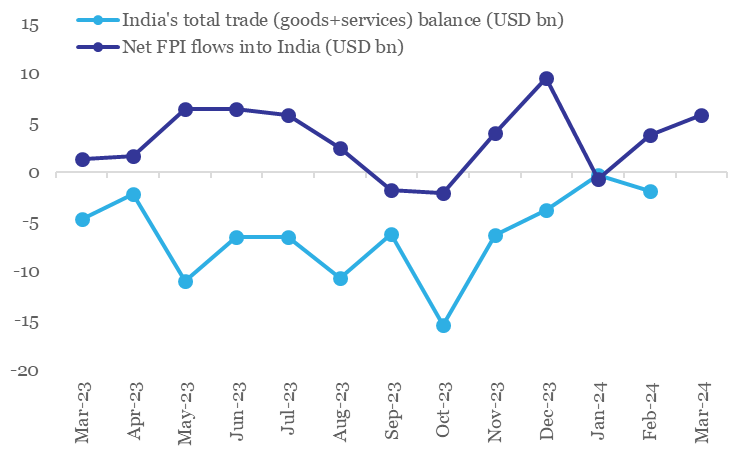
Source: CEIC, QuantEco Research
Note: FPI flow data for Mar-24 is until 21st
4. CYTD price change in key commodity groups and shipping cost

Note: (i) Price change is between Mar 15, 2024 and Dec 31, 2023; (ii) Oil price is represented by Brent; (iii) Agriculture Items, Industrial Metals, and Precious Metals are represented by respective Bloomberg Commodity indices; (iv) rounded off figures represented.
Data: Refinitiv, QuantEco Research

FY25 Interim Budget; outlook on monetary policy and rupee
The month of Feb-23 started with the presentation of the interim budget for 2024-25. We parse through the signals to look at key takeaways along with implication of exporters. This is followed by a quick assessment of US and India’s monetary policy along with the outlook on the Indian rupee.
1. FY25 Interim Budget prioritizes fiscal consolidation
The central government presented the 2024-25 interim budget (this will be superseded by the normal budget post the new government formation in Jun/Jul 2024) on Feb 1st, 2024. Although this was a vote-on-account, the Finance Minister clearly emphasized on the policy priority of maintaining macroeconomic soundness via two primary avenues:
- Accelerating the process of fiscal consolidation
- After revising lower the fiscal deficit target for 2023-24 to 5.8% of GDP from 5.9% earlier, the interim budget consolidated further, with target for fiscal deficit budgeted at 5.1% of GDP for 2024-25, lower than market expectation of 5.2-5.4%.
- Prioritization of capital expenditure
- Allocation for capital expenditure is set to increase to a 20-year high of 3.4% of GDP in 2024-25 vis-à-vis 3.2% in 2023-24. Bulk of the capex allocation in 2024-25 will be geared towards the transport (esp. roads and railways) and defence sectors.
Chart 1: While fiscal deficit is set to reach its post pandemic low in 2024-25, allocation for capex is set to create a record multi-decade high
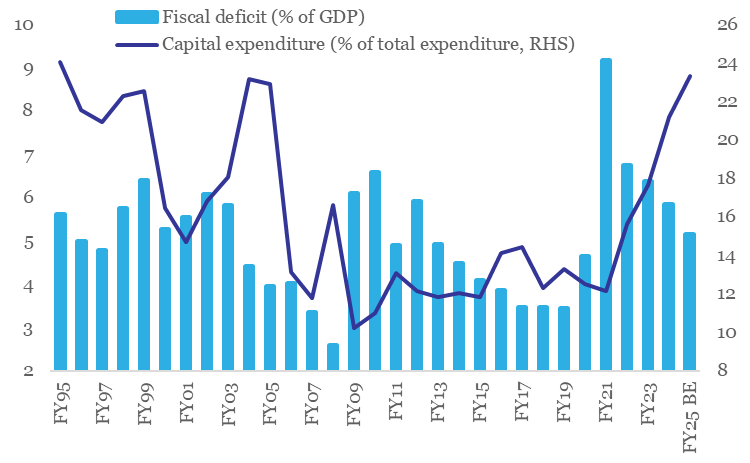
Source: Budget documents, CEIC, QuantEco Research
While that’s comforting from the perspective of overall macro stability and investor confidence, specific allocation towards external trade (under the Department of Commerce) saw a sizeable pruning.
- Specific trade related expenditure is set to contract by 41% in 2024-25 after witnessing a 16% contraction in 2023-24
- Bulk of the contraction budgeted in 2024-25 is an account of lower allocation for Interest Equalisation and Duty Drawback Schemes
- Notwithstanding the headline contraction, allocation for Assistance to Special Economic Zones and towards WTO activities are budgeted for a moderate expansion.
Table 1: Specific trade related budgetary allocation to get pruned in 2024-25
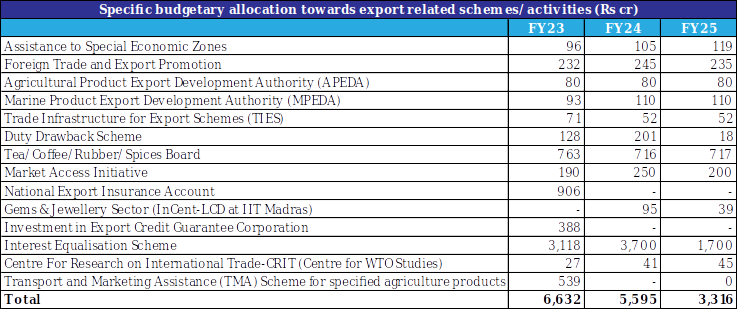
Source: Budget documents, QuantEco Research
The sharp cut in the budgetary expenditure for the Department of Commerce in 2024-25 is not surprising as it accounts for the expiry of the Interest Equalisation Scheme after Jun-24. We do not believe this to have a material repercussion as recent steps taken by the government for export promotion are still playing out (for e.g., The Foreign Trade Policy, TIES/ MAI/ RoDTEP Schemes, Common Digital Platform for Certificate of Origin, facilitation of Districts as Export Hubs, promotion of e-commerce exports, etc.). Nevertheless, if some support is warranted on account of ongoing geopolitical disruptions (persistence of Red Sea disturbance could increase cost for exporters), the government could then look at extending the same in the upcoming normal budget in Jun/Jul 2024. Alternatively, with the Foreign Trade Policy now becoming dynamic, an addendum could get included to partially mitigate the adverse cost impact of geopolitical disruptions.
Chart 3: Global merchandise trade could potentially see a mild adverse impact due to disturbance in the Red Sea route
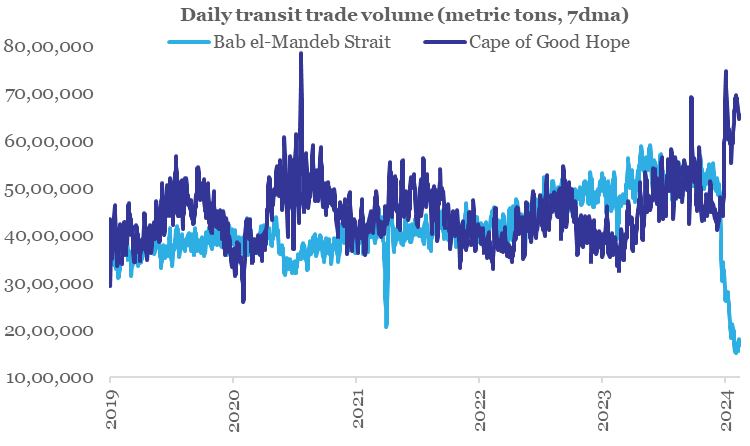
Source: IMF PortWatch, QuantEco Research
Note: The Red Sea region is a systemically important shipping lane that facilitates about 11% of global maritime trade. The key chokepoint lies around the Bab el-Mandeb Strait area, which in turn is connected to the Suez Canal, and is an important conduit for global maritime trade, connecting regions like Asia, Middle East, West & North Africa, Europe, and US East Coast. Most vessels are currently avoiding the Bab el-Mandeb Strait and opting for the longer route via the Cape of Good Hope.
2. Outlook on monetary policy
After maintaining a pause for four consecutive monetary policy reviews between Sep-23 and Jan-24 2023, the US Federal Reserve is once again expected to maintain the fed funds rate range unchanged at 5.25-5.50% in its forthcoming policy review meeting on Mar 20, 2024.
In the month of Jan-24, market participants were expecting the Fed to deliver cumulative rate cut of 125-150 bps from the Fed in 2024. We had highlighted that this seemed aggressive given residual inflationary pressures in the US economy, which has been witnessing a slower than anticipated loss of growth momentum.
Since then, the reversal of the rate tightening cycle by the Fed has got priced out, with market participants now expecting the first rate cut in Jun-24 vs. Mar-24 earlier. With this, the cumulative Fed rate cut expectation by market participants for 2024 currently stands adjusted at 75-100 bps. We believe the pricing now appears somewhat reasonable and investors should start positioning for the easing of US rate cycle from mid-2024 onwards.
With this as a backdrop, other key central banks could also begin their rate easing cycle with a lag. In case of India, as CPI inflation starts providing durable comfort in the coming quarters, we expect the RBI to start cutting repo rate from Oct-24 onwards with scope for up to 75 bps cumulative rate cut by Mar-25.
Table 2: Market expectation for rate easing is getting aligned with Fed member’s projections
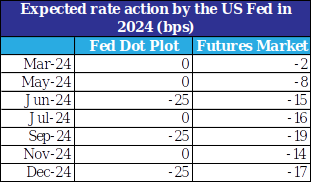
Source: Federal Reserve, Refinitiv, QuantEco Research
Note: Fed Dot Plot reflects the median expectation of rate cuts by Fed members (as of Dec-23)
3. Rupee view
After facing persistent, albeit mild depreciation pressure over five consecutive months, INR is finally trying to recoup some of its losses. It appreciated by 0.2% each in Dec-23 and Jan-24 (closing the month at 83.04) and has gained another 0.1% in the month of Feb-24 so far (currently trading close to 82.97 levels).
- We continue to believe that INR could remain supportive in Q4 FY24 on account of favorable year-end seasonality and market positioning ahead of India’s inclusion in JPM EM bond index (from Jun-24). In the last 5-months, India has received net foreign portfolio debt inflow of USD 9 bn, exceeding equity inflow of USD 2.9 bn.
- While global geopolitical risk and domestic election related uncertainties remain on the table, the tail risks have reduced significantly amidst range-bound movement in commodity prices and the state elections that on aggregate basis went in favor of the incumbent BJP government at the centre.
Although the factors for a mild near-term appreciation in INR remain in place, we believe it is unlikely to result in a durable trend due to RBI’s active intervention in the FX market (during Sep-Dec 2023, the central bank cumulatively bought and sold record high amount of USD 131 bn and USD 133 bn on gross basis respectively, even as the cumulative net intervention was at a paltry USD 1.7 bn of sold position).
Overall, we maintain our USDINR call of 82.5 by Mar-24 and 84.5-85.0 by Mar-25.
Chart 4: Post the announcement of India’s inclusion in JPM EM Bond Index in Sep-23, foreign debt inflow has picked up pace
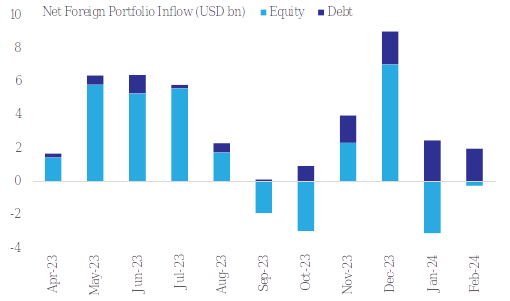
Source: CEIC, QuantEco Research
Note: Data for February is till 21st
4. CYTD price change in key commodity groups and shipping cost

Note: (i) Price change is between Feb 20, 2024 and Dec 31, 2023; (ii) Oil price is represented by Brent; (iii) Agriculture Items, Industrial Metals, and Precious Metals are represented by respective Bloomberg Commodity indices; (iv) rounded off figures represented.
Data: Refinitiv, QuantEco Research
