
As India concluded a successful G20 Leaders’ Summit in Sep-23, we look at its implications for global trade as well as India. This is followed by taking stock of the change in direction in India’s merchandise trade deficit, followed by a quick assessment of US and India’s monetary policy along with our outlook on rupee.
1. G20 and trade implications
The G20, comprising of 19 countries and the EU, together accounts for 67% of world population, 75% of world trade, and 85% of world GDP. The G20 Trade and Investment Ministers’ Meeting (TIMM) reached consensus on five key areas:
- Digitalization of trade documents: This adoption of non-binding agreement will recognize electronic trade documents as equivalent to paper documents, thereby reducing trade costs and lowering barriers to entry for MSMEs.
- Enhancing access to information for MSMEs: The G20 TIMM adopted ‘Jaipur Call for Action for Enhancing MSMEs’ Access to Information’. This is about using the latest technologies to upgrade the Global Trade Helpdesk, a joint initiative of the ITC (International Trade Centre), the WTO (World Trade Organization) and the UNCTAD (UN Conference on Trade and Development) to provide analytical, user-friendly and easily accessible trade information for MSMEs.
- Generic mapping framework for Global Value Chains (GVCs): The trade ministers endorsed this framework that contains key building blocks of data, analysis, and representation of GVC data. The framework also advocated to identify key dimensions to help evaluate the resilience of GVCs both at the sectoral and product levels.
- Voluntary sharing of best practices on MRAs (Mutual Recognition Agreements) for Professional Services: The compilation of good practices will spur MRAs that will enable recognition of technical qualifications for professional service providers like doctors, nurses, lawyers, architects, etc. by all member countries. It will help Indian professionals in providing their technical services across the world.
- G20 Standards Dialogue: To reduce regulatory divergences and associated trade costs, and monitor trade and investment-related measures, G20 Standards Dialogue in 2023 will be held to bring together members, policymakers, regulators, standard-setting bodies and other stakeholders to discuss topics of common interest such as good regulatory practices and standards.
Besides the G20 New Delhi Declaration (that highlights pertinent trade related aspects above), the Summit also served useful for making progress on trade deals/treaties.
- India has signed an MoU with Saudi Arabia, UAE, European Union, France, Germany, Italy, and the US to establish the India Middle East Europe Economic Corridor (IMEC). This will be a transnational rail and shipping route spread across two continents, which is expected to stimulate economic development through improved connectivity and economic integration between Asia, Arabian Gulf and Europe. For India, this holds immense promise of reducing export related costs to the Middle East and Europe. However, the gains are likely to accrue in the longer term.
- From FTA perspective, progress is currently underway on individual agreements with UK, EU, and Australia. To recall, India & Australia already have Economic Cooperation & Trade Agreement in place, effective December 2022. Among these, the India-UK FTA is expected to go through first.
Meanwhile, India and Canada have “paused” their negotiations on the bilateral FTA on account of ongoing political tensions between the two countries. As per media reports, there is currently no timeline for resuming the India-Canada talks on the Comprehensive Economic Partnership Agreement (CEPA).
Chart 1: G20 partners have ~64% share in India’s merchandise trade
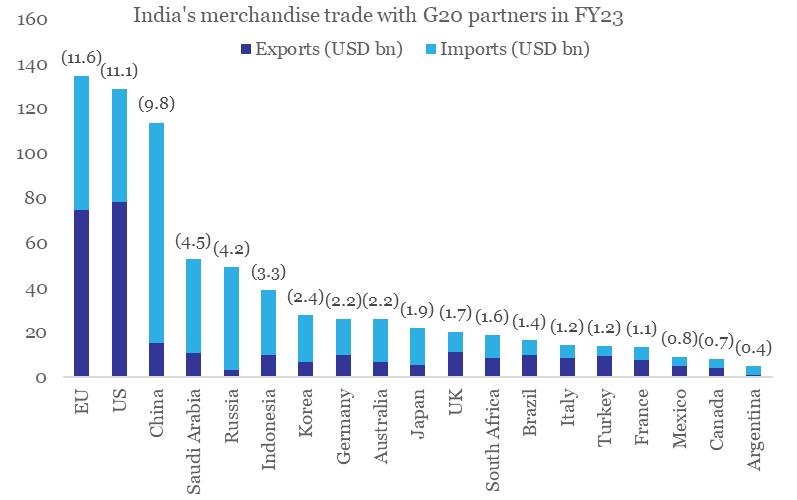
Note: Figures in parenthesis indicate respective % share in India’s total merchandise trade
Data: CEIC, QuantEco Research
Nine items that dominate India’s exports with G20 partners: (i) Mineral fuels and products, (ii) Organic chemicals, (iii) Nuclear reactors, boilers, machinery & appliances, (iv) Electrical machinery, (v) Pharmaceutical products, (vi) Vehicles & parts, (vii) Iron & steel, (viii) Aluminium & articles, and (ix) Misc chemical products.Chart 2: Top commodity exported by India to G20 partners in FY23
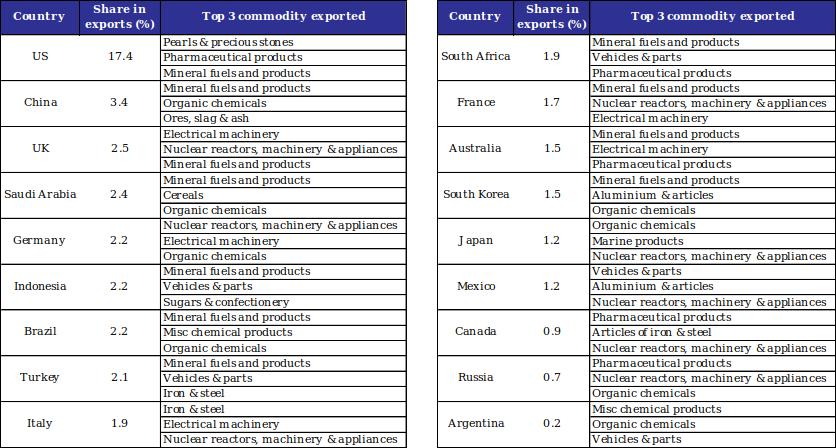
Data: Ministry of Commerce, CEIC, QuantEco Research
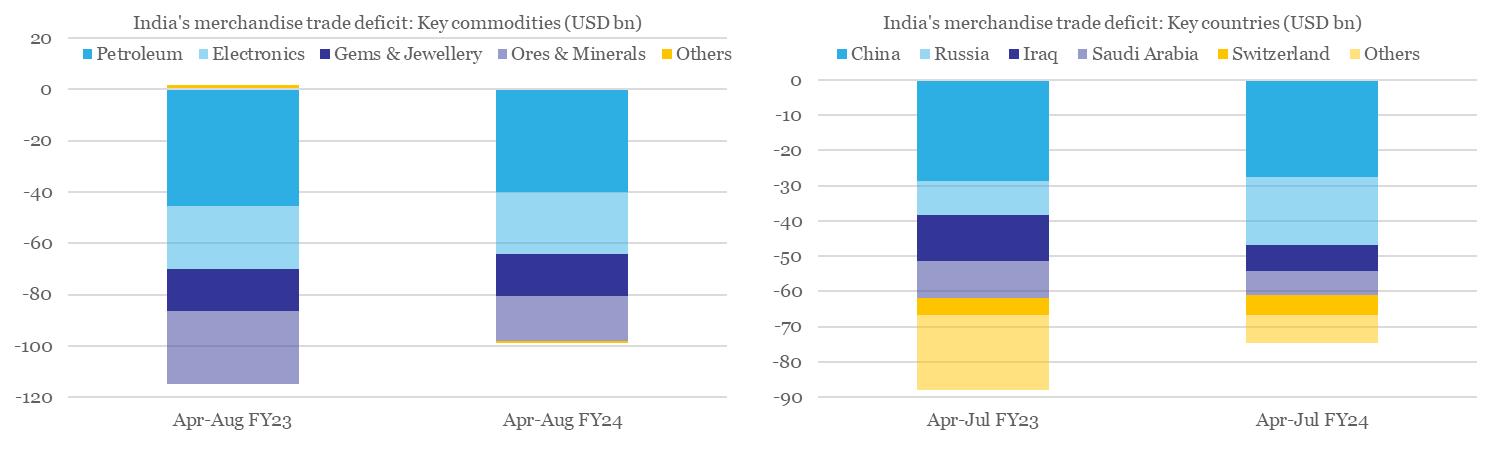
2. India’s monthly merchandise trade deficit is gradually expanding
India’s merchandise trade deficit has been gradually expanding and touched a 10-month high of USD 24.2 bn in Aug-23 (up from USD 18.5 bn in Jul-23, while close to USD 24.9 bn in Aug-22). Increase in commodity prices in recent months has been one of the key reasons behind the same – we note that the CRB Commodity Index averaged at 311 in Aug-22 as well as in Aug-23!
- However, on FYTD (Apr-Aug) basis, trade deficit is cumulatively running lower by USD 14 bn. This is largely due to narrowing of the deficit on account of Ores & Minerals and Petroleum Products.
- From country perspective, the cumulative narrowing of FYTD merchandise trade deficit is being driven by Iraq and Saudi Arabia.
Chart 3: Comparison of FYTD performance of India’s merchandise trade deficit
3. Outlook on US monetary policy
Along expected lines, the US Federal Reserve left monetary policy rate unchanged at 5.25-5.50% in its Sep 20th review meet. Interestingly, while the revised dot plot* continues to highlight room for one more round of rate hike in 2023, it now suggests a greater emphasis on interest rates being ‘higher for longer’. As per the Sep-23 dot plot, the FOMC (Federal Open Market Committee) now projects 50 bps rate cut in 2024, lower than the projected 100 bps rate cut as per the previous dot plot of Jun-23.
Market participants are currently attaching a ~31% probability to a rate hike in the next policy review in Nov-23. As of now, market participants expect the Fed to commence its rate easing cycle from Jun-24 onwards, with likelihood of a cumulative 75 bps rate cut before the end of 2024.
Chart 4: Fed is emphasizing on interest rates being ‘higher for longer’
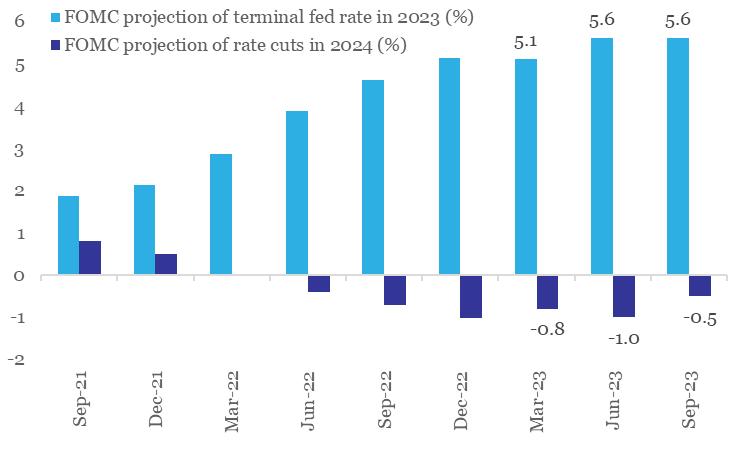
Data: FOMC, QuantEco Research
4. Outlining our expected rupee trajectory
The Indian Rupee weakened to a record low in Sep-23 on the back of a combination of factors:
- Monetary policy divergence between the two largest countries (US poised for one final round of rate hike while China just delivered two rate cuts) is resulting in a stronger USD and a weaker CNY. Both are individually weighing upon INR.
- Recent jump in global commodity prices, esp. crude oil, from an average of USD 75 pb in Jun-23 to USD 92 pb in Sep-23 (so far) would put trade deficit under pressure.
We expect the above-mentioned factors to persist in the near term because of which INR could weaken towards 84 levels within the next 3-months. Going forward, we expect the INR to partially reclaim lost ground and move towards 82 levels amidst favorable Q4 seasonality and anticipated USD weakness as market participants position for a pivot in US monetary policy cycle by mid 2024.
4. Key CYTD changes in price
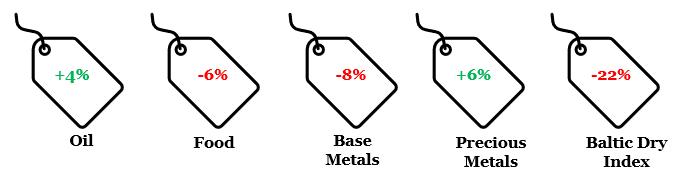
Note: Price change is between Aug-23 and Dec-22 for respective generic indices
Data: World Bank, Refinitiv, QuantEco Research
