
The simmering of Israel-Hamas war continues to provide sporadic jitters to world trade. With 2023 coming to an end, we offer a bird’s eye view of merchandise trade performance. This is followed by a quick assessment of US monetary policy along with the outlook on Indian rupee.
1. 2023 global merchandise: Winners and losers
World merchandise trade experienced a decline through 2023 on account of moderation in demand as well as commodity prices. As per the UNCTAD (United Nations Conference on Trade and Development), the value of world merchandise trade is estimated to contract by approximately USD 2 trillion, representing a 7.5% fall compared to 2022.
On volume basis, while the aggregate picture is less sombre (as per CPB Netherlands, global merchandise trade expanded by 0.1% between Oct-23 and Dec-22), it is predominantly being driven by China and US. In contrast, Europe has performed poorly (amidst concentration of recent geopolitical risks), while Japan has nearly struggled to maintain last year’s run rate.
Chart 1: Among key economies, Eurozone and UK seem to have borne the brunt of trade slowdown in 2023
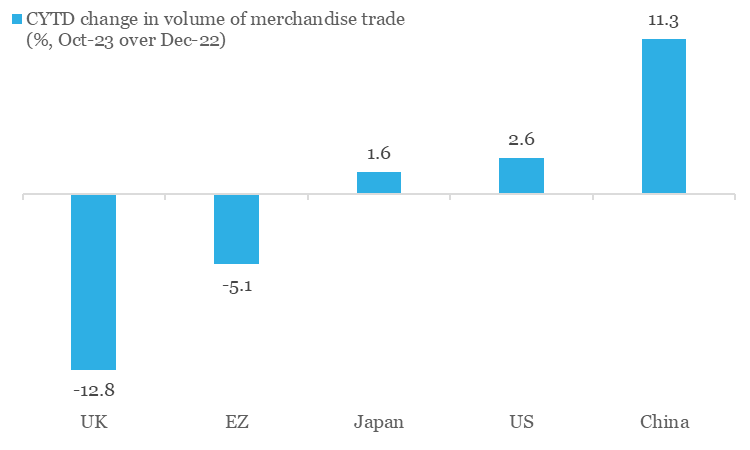
Source: CPB Netherlands, QuantEco Research
The upcoming year offers a sliver of hope with most multilateral bodies projecting a moderate recovery in world merchandise trade – as per the WTO, volume of global merchandise trade is projected to increase by 3.3% in 2024 compared to an estimated growth of 0.8% in 2023. Having said, there are notable risks that could continue impeding recovery in world trade:
- On aggregate basis, the IMF expects World GDP growth to post a mild moderation to 2.9% from an estimated level of 3.0% in 2023. Lagged impact of tight financial conditions, simmering geopolitical risks (like the recent disturbance in the Red Sea trade route) and volatility in commodity prices could continue to provide uncertainty.
- Trade protectionism has risen sharply in 2023. The resurgence in the use of industrial policy and the urgency of meeting climate commitments are driving changes in trade policies, both in the form of tariffs and non-tariff measures.
Chart 2: Protectionism continues to rise, inflicting harm on global trade
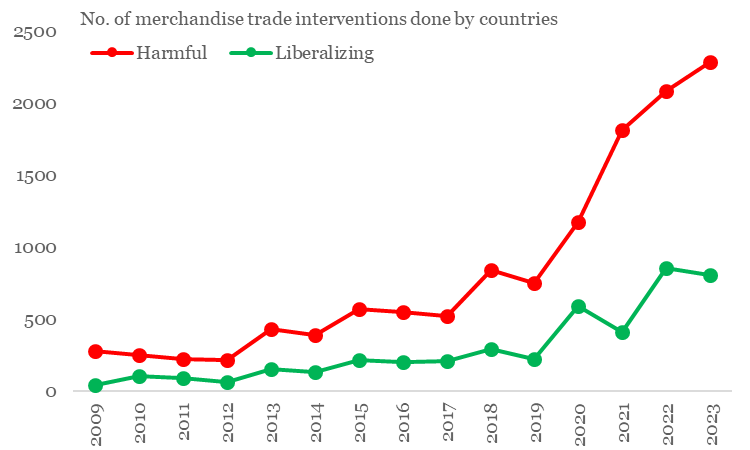
Source: GTA, QuantEco Research
For India, 2023 has been dismal for exporters, with cumulative exports seeing a ~5% contraction (data available until Nov-23) in value terms over 2022. A cursory glance at India’s headline export performance since 2009 reveals a higher frequency of contraction compared to the earlier period. The 15-year period between 1994-2008 saw just one year of export contraction for India. In contrast, the 15-year period between 2009-2023 saw seven episodes of contraction in India’s exports – that’s almost 47% of the time! Rise of trade protectionism and shortening of global business cycle since the 2008 Global Financial Crisis (besides one-off factors like COVID) appear to have significantly weighed on external trade sentiment.
Chart 3: Frequency of India’s export contraction has increased in last few years
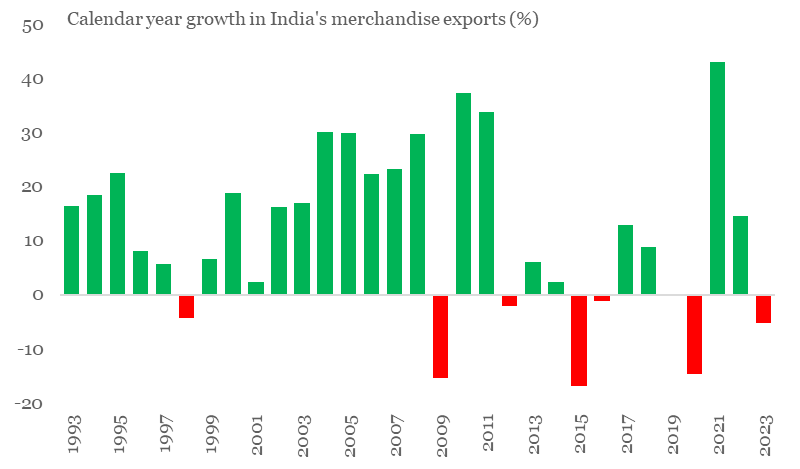
Source: CEIC, QuantEco Research
Looking one level beneath the surface, we find that export of Electronic Items has so far had a fantastic performance in 2023 with a robust growth of 35.3% YoY (led by telecom instruments), while the Gems & Jewellery sector, with a contraction of 19.2% YoY (primarily on account of pearls and other precious/semi-precious stones), bore the maximum brunt.
Chart 4: India’s exports in 2023: What went and down
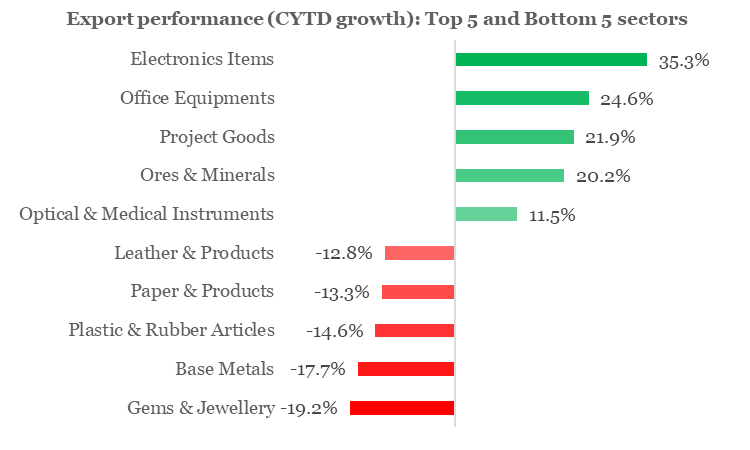
Source: CEIC, QuantEco Research
2. Outlook on monetary policy
Along the expected lines, the US Fed maintained status quo on policy rates at its Dec-23 policy review. This marks the third consecutive meeting of no rate action by the Fed, with fed funds rate range being maintained at 5.25-5.50%. However, the highlight of the meeting was the projection of cumulative 75 bps rate cuts by the FOMC (Federal Open Market Committee) members in 2024, an upward revision from 50 bps earlier in Sep-23. This was perceived as a dovish signal by market participants, who have now started to price in 125-150 bps of cumulative rate in 2024, with 93% implied probability (derived from fed funds futures) of first rate cut in Mar-24.
We continue to believe that the likelihood of an early reversal of the rate tightening cycle by the Fed is relatively low on account of residual inflationary pressures amidst slower than anticipated loss of growth momentum. As such, we continue to expect the Fed to start its rate cutting cycle from Jun-24 onwards.
3. Rupee view
After facing persistent, albeit mild depreciation pressure over five consecutive months, INR is finally trying to recoup some of its losses. This is broadly in line with our moderately constructive call on INR (82.5 levels by Mar-24).
- The dovish Fed policy outcome in Dec-23 has fuelled risk-on sentiment, thereby putting pressure on the US dollar, while benefiting other currencies, including the INR.
- We continue to believe that INR could remain supportive in Q4 FY24 on account of favorable year-end seasonality and market positioning ahead of India’s inclusion in JPM EM bond index (from Jun-24).
- While global geopolitical risk and domestic election related uncertainties remain on the table, the tail risks have reduced significantly amidst range-bound movement in commodity prices and the recently concluded state elections (that on aggregate basis went in favor of the incumbent BJP government at the centre).
Although the factors for a mild near-term appreciation in INR is emerging, we believe it is unlikely to result in a durable trend due to RBI’s active intervention in the FX market (during Sep-Oct 2023, the central bank bought and sold record high amount of USD 32 bn and USD 33 bn on average gross basis respectively, even as net intervention averaged at a paltry USD 0.9 bn of sold position). In addition, Fed’s rate easing cycle in 2024 would soon be followed by key central banks, thereby reducing the current bearishness on the USD.
Table 1: Market participants are more gung-ho about their Fed rate cut expectations vis-à-vis the FOMC members
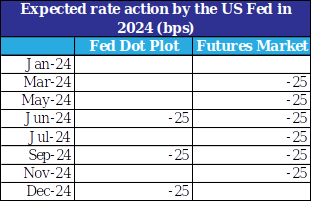
Note: Fed rate action has been averaged basis cumulative projection of 75 bps cut by the FOMC
Data: FOMC, Refinitiv, QuantEco Research
4. CYTD price change in key commodity groups and shipping cost
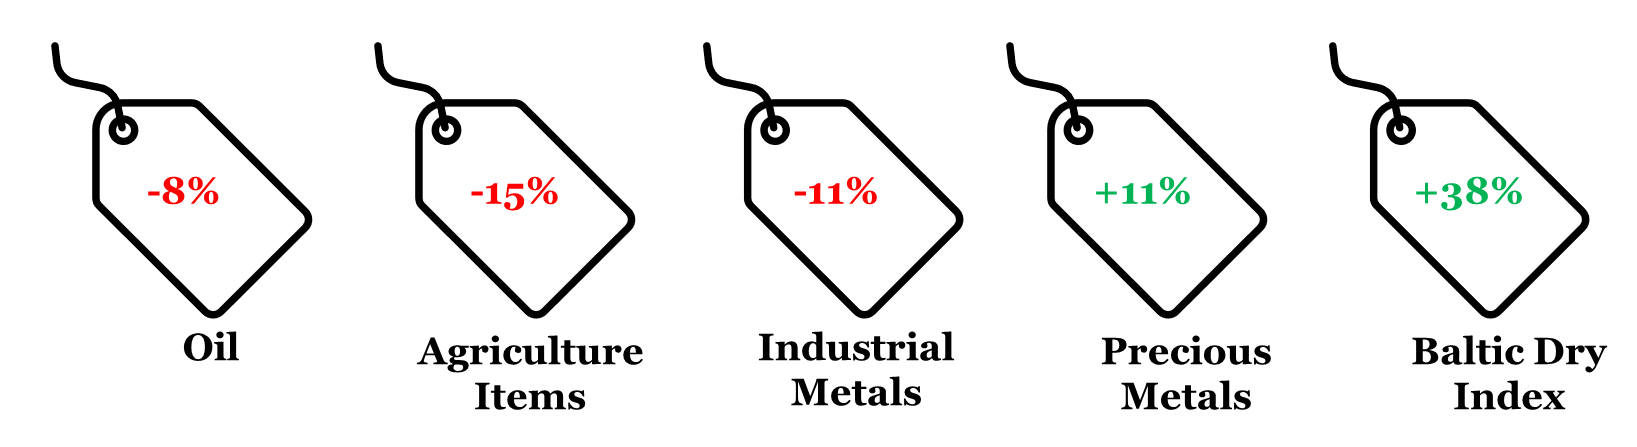
Note: (i) Price change is between Dec 22, 2023 and Dec 31, 2022; (ii) Oil price is represented by Brent; (iii) Agriculture Items, Industrial Metals, and Precious Metals are represented by respective Bloomberg Commodity indices; (iv) rounded off figures represented.
Data: Refinitiv, QuantEco Research
