One year of war, record weakness in export financing, and reassessment of Fed rate trajectory
The Russia-Ukraine war has completed one year with no signs of resolution in the near term. In this newsletter, we take a look at winners and losers from the perspective of India’s merchandise exports at destination as well as commodity level in the last 12-months dominated by disruptions on account of the war. We round it up with an update on export credit performance along with our customary commentary on INR.
1. Winners and losers from Russia-Ukraine war
At headline level, India’s merchandise exports moderated from USD 37.2 bn in Feb-22 to USD 32.9 bn in Jan-23 (while the slowdown cannot be completely attributed to the Russia-Ukraine war, the disruptions from it aggravated the global inflation scenario, which in turn attracted aggressive monetary tightening from most central banks, thereby impacting external demand).
From destination perspective:
- Netherland emerged as the top gainer, with its share in India’s export basket jumping from 3.9% in Feb-22 to 6.9% in Jan-23
- Australia emerged as the top loser, with its share in India’s export basket declining from 3.1% in Feb-22 to 1.2% in Jan-23
From commodity perspective:
- Petroleum Products became the top gainer, with its share in India’s export basket jumping from 18.6% in Feb-22 to 23.3% in Jan-23
- Iron & Steel became the top loser, with its share in India’s export basket declining from 4.7% in Feb-22 to 2.9% in Jan-23
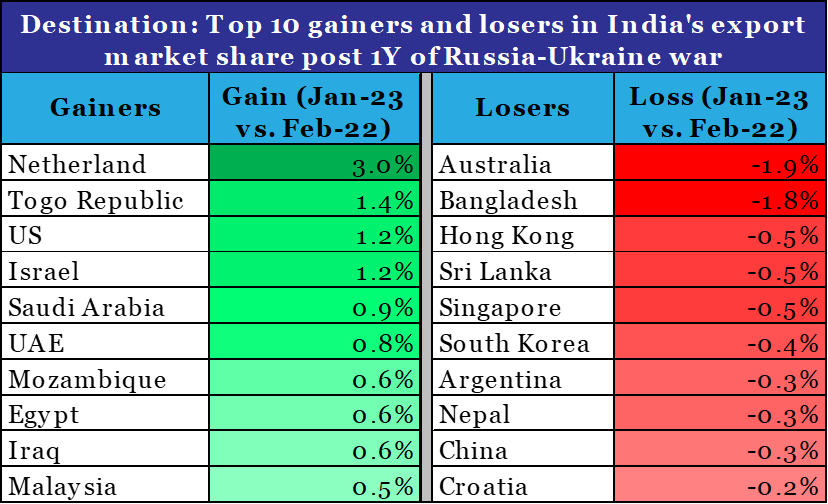
Data: Ministry of Commerce, QuantEco Research
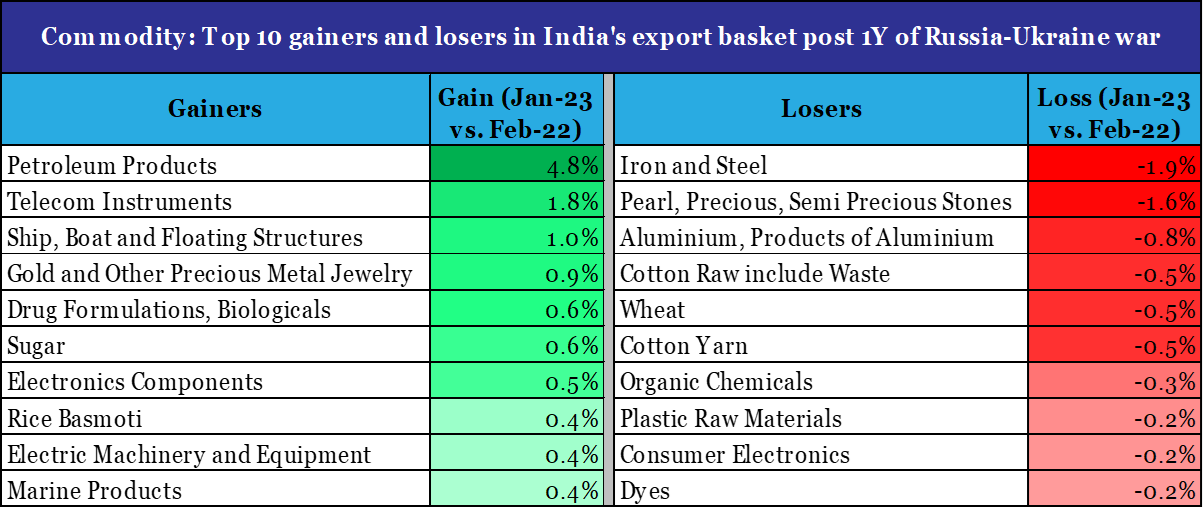
Data: Ministry of Commerce, QuantEco Research
Although global value chain disruptions have eased compared to one year ago levels, the nature of disruption from the war could continue to have a similar impact on destination and commodity wise performance of India’s exports. We can expect the top beneficiaries and losers to by and large remain unchanged at least in the near term.
2. Weakness persists in export financing
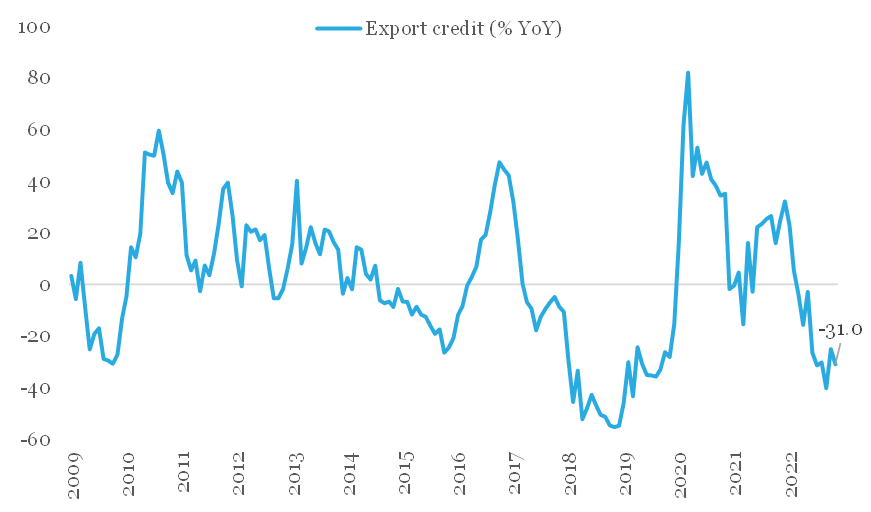
Amidst slowdown in India’s exports, export financing continues to maintain its declining trend. On annualized basis, export credit has been in contraction since Mar-22, with Jan-23 print of -41.4% being the lowest in nearly 4-years. The overall value of outstanding export credit from banks has fallen to Rs 14,390 cr in Jan-23 from Rs 23,681 cr in Mar-22.
The ratio of export credit to value of merchandise exports (a proxy for extent of export financing coverage) is currently at its lowest levels around 5.0%. As per media reports, with demand uncertainty persisting, exporters are either delaying shipment orders or are not extending the terms of the contract.
Export finance contracting amidst uncertainty
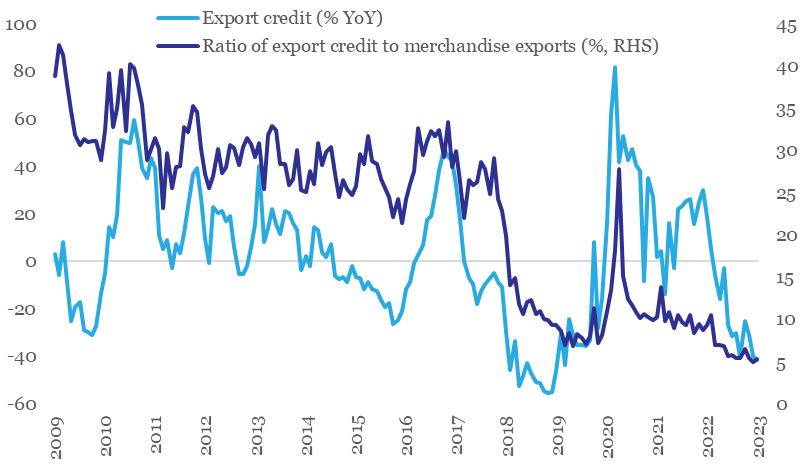
Data: RBI, QuantEco Research
INR: Reassessment of Fed rate trajectory supporting dollar
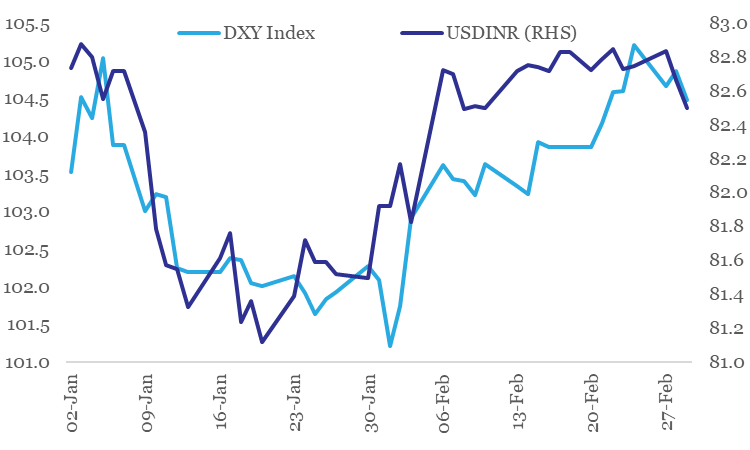
The Indian Rupee depreciated by 0.9% in Feb-23. This was predominantly a reflection of underlying strong recovery of the US Dollar. The dollar index gained sharply by 2.7% in Feb-23 as market participants priced in additional 75 bps rate hike from the US Fed (vs. 25-50 bps earlier) on account of recent strong economic data in US coupled with firm inflation numbers. Noticeably, market participants have now priced out rate cuts from last quarter of 2023 (vs. expectation of 25-50 bps rate cut earlier).
We had highlighted our USDINR call of 83.5 levels by Mar-23 in previous editions of Credlix Finsights. We continue to maintain the same and expect USDINR to further move higher towards 85.5 levels by Mar-24 on likelihood of persistence of deficit in India’s Balance of Payments.
INR is moving in tandem with USD in 2023 so far
Data: Refinitiv, QuantEco Research
Website: https://www.quanteco.in/

Update on global economy, India Budget highlights and US monetary policy
The week gone by saw two major economic events relevant for India along with a key economic forecast update for the global economy
1. Taking stock of global economic forecasts
The International Monetary Fund in its quarterly review of the global economy presented few notable changes in its key economic forecasts.
- While World GDP growth forecast for 2023 got revised up, projection for the incremental loss of momentum compared to 2022 remains unchanged at 50 bps. The mark-up predominantly reflects the re-opening impact of the Chinese economy.
- Recovery expectation for 2024 remains intact; although it is likely to be mild, with World GDP growth forecasted to be lower vs. the long term (2000-19) average of 3.8%.
- Forecast for volume of world trade (goods + services) saw a downward revision for both 2023 and 2024, although 2024 continues to depict a moderate recovery in global trade volumes.
IMF’s key global economic forecasts (%, as of Jan-23)
| 2022 Estimate | 2023 Forecast | 2024 Forecast | |
| World GDP | 3.4 (+0.2) | 2.9 (+0.2) | 3.1 (-0.1) |
| US | 2.0 (+0.4) | 1.4 (+0.4) | 1.0 (-0.2) |
| Eurozone | 3.5 (+0.4) | 0.7 (+0.2) | 1.6 (-0.2) |
| UK | 4.1 (+0.5) | -0.6 (-0.9) | 0.9 (+0.3) |
| China | 3.0 (-0.2) | 5.2 (+0.8) | 4.5 (no change) |
| India | 6.8 (no change) | 6.1 (no change) | 6.8 (no change) |
| World Trade Volume (Goods + Services) | 5.4 (+1.1) | 2.4 (-0.1) | 3.4 (-0.3) |
Data: IMF, QuantEco Research
In the near term, the massive earthquake in Turkey (besides its humanitarian impact) is likely to have a mild impact on India’s exports, which stood at USD 10.0 bn in 2022 (2.2% in India’s export basket). As per the Global Trade Research Initiative, suspension of one of the two main container ports is Turkey will delay shipments and could potentially take about a month to normalize its activity. It is likely that discretionary items like Yarns, Dyes, and Gems & Jewellery could see negative export growth in Feb-Mar 2023.
2. Key takeaways from the 2023-24 Union Budget
- Target for fiscal deficit was lowered to 5.9% of GDP from 6.4% in 2022-23.
- While the Budget refrained from any big bang policy announcements, quality of spending got a significant boost with hike in allocation for capital expenditure to a two decade high of 3.3% of GDP from 2.7% in 2022-23. Bulk of the capex in 2023-24 would be driven by railways, roads, defence, telecom, petroleum, and housing & urban development.
- From exports perspective, the Budget hiked allocation for some key schemes like the Remission of Duties and Taxes on Export Products (up 10.0% to Rs 15069 cr), Rebate of State and Central Taxes and Levies (up 12.7% to Rs 8405 cr), and Interest Equalisation Scheme (up 23.4% to Rs 2932 cr). This is expected to help improve cost efficiency for SME exporters.
- Targeted reduction in import duty for specific products will build on
addto the competitiveness of exports of chemical products, marine products, gems & jewellery, and electronic items. In addition, the Budget increased the allocation for the PLI (Performance Linked Incentives) Scheme by 67.7% to Rs 8,083 cr, with bulk of the increase earmarked for electronics & hardware, food processing, automobiles, and pharmaceuticals sector.
3. US central bank normalizes rate hikes
The US Federal reserve announced a 25 bps rate hike on Feb 1st , taking the fed funds rate range to 4.50-4.75%, taking cumulative tightening done since 2022 to 450 bps. Market participants expect one further round of 25 bps rate hike in Mar-23 before the Fed gets into a pause.
The downshift in Fed’s monetary policy aggression will reduce the pressure on other central banks. As expected, the RBI has also stepped down in magnitude of rate hike to 25 bps in Feb-23 from 35 bps in Dec-22. Going forward, we expect the RBI to announce its last rate hike of 25 bps in Apr-23, after which it could get into a pause mode for impact assessment.delivered its final 25 bps rate hike in the current tightening cycle on Feb 8th, after which it is expected to maintain an extended pause.
INR: Starts 2023 on a positive note, but mild depreciation bias to persist
The Indian Rupee appreciated by 1.0% in the month of Jan-23, which was predominantly a reflection of underlying weakness in the US Dollar. Expectation of rate hike cycle ending earlier in US vis-à-vis its key peers is weighing upon the dollar. While this could provide some near-term appreciation pressure on INR, we believe the RBI would use this opportunity to rebuild FX reserves (by purchasing USD) and thereby limit INR appreciation. We continue to expect USDINR to trade close to 83.5 levels by Mar-23, and towards 85.5 levels by Mar-24 on likelihood of persistence in India’s Balance of Payments Deficit.
India’s FX reserves have increased for four consecutive months
Note: Data is for end of month; for Jan 2023, it is for week ending 27th. Change in reserves can be on account of actual purchase/sale of dollars and gold by the RBI along with revaluation impact.
Data: RBI, QuantEco Research
* BoP deficit for 2022-23 is our forecast. Change in USDINR in 2022-23 is as of Jan 17th.
What should Exporters Do ?
- Be cautious on Buyer Credit risk and mitigate 100% of the exposure using Export Factoring or Credit Insurance (ECGC, private) for all of their exports. 2023 still seems quite a volatile year and not the time to take any form of risk on Buyers (for open account business).
- There is expectation that this year sizable demand from US/EU that was catered by China will move to India (China + 1) especially across Synthetic Apparels, Pharma, Metal fabricated products, handicrafts, toys, leather products, etc. This can be a good opportunity to build scale for Indian exporters.
Website: https://www.quanteco.in/
Export assessment survey, export credit, and Budget expectations
As 2023 commences, we take this opportunity to look beyond usual export statistics and evaluate how the enabling environment appears from the perspective of sentiment, finance, and expectations from the upcoming Union Budget 2023-24.
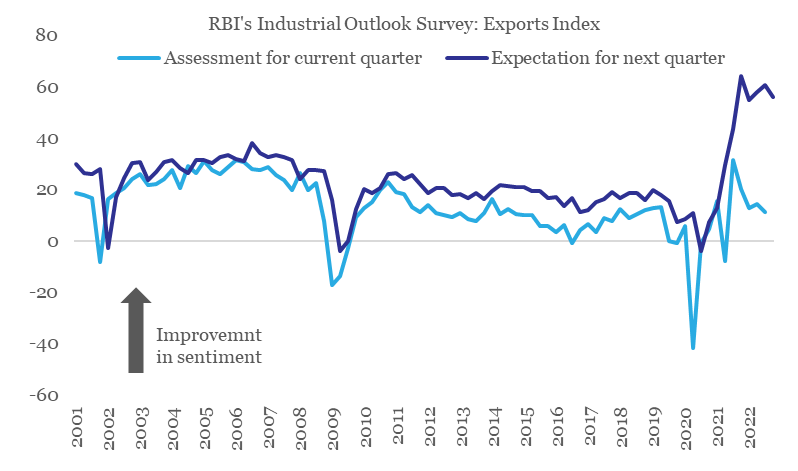
1. Export sentiment
As per RBI’s Industrial Outlook Survey, the index for exports (capturing current assessment and expectations) has been on a declining trend after peaking out in Q2-Q3 of 2021-22. This trend in survey-based sentiment indicators for exports appears to be confirming the slowdown in external demand.
Export sentiment on a declining trend
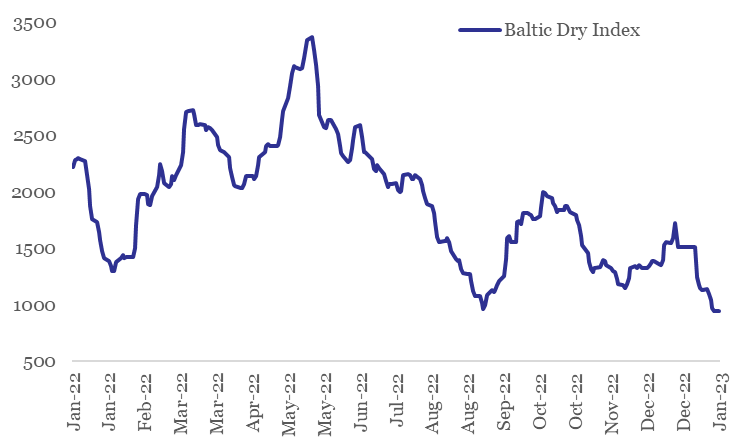
From near term perspective, the sharp slide in Baltic Dry Index1 (-37.6% in Jan-23 so far) is concerning and points towards tepid global trade. However, the impact currently is likely to be exaggerated on account of Chinese New Year holiday and the upcoming monsoon season in Brazil. In fact, with easing of COVID restrictions and re-opening of Chinese economy, global trade could see a spurt in near term momentum (post the commencement of the extended holiday season).
Sharp slide in Baltic Dry Index in Jan-23
2. Export financing
Amidst slowdown in India’s exports, export financing has also seen a sharp decline – on annualized basis, export credit has been in contraction since Mar-22. The overall value of outstanding export credit from banks has fallen to Rs 15,506 cr in Nov-22 from Rs 23,621 cr in Mar-22. As per media reports, with demand uncertainty persisting, exporters are either delaying shipment orders or are not extending the terms of the contract.
Export credit has contracted for nine consecutive months
3. Expectations from the 2023-24 Union Budget
Amidst headwinds from slowing demand and rising cost burden, the government could be considering raising interest equalization or subsidy benefits (by up to 2%) extended to MSME exporters. This is likely to benefit exporters from labour-intensive sectors like ready-made garments, toys, handicrafts, auto components, and processed food. In addition, the government could also be considering laying incentives for setting up of domestic Testing & Certification centres for MSME exporters and expansion of TReDS (Trade Receivables Discounting System) services to cover larger number of MSMEs and PSUs/ Corporates.
INR: Under BoP2 pressure
India’s net balance of payment (BoP) registered a deficit of 3.7% of GDP in Jul-Sep quarter of 2022-23 – this was the widest deficit since the 2008 Global Financial Crisis. Wide trade/ current account deficit and insufficient capital flows to fund them were the key underlying reasons for the same.
A BoP deficit reflects greater demand for dollars, and hence pressure on rupee. As such, INR weakened by 3.0% during Jul-Sep quarter of 2022-23 (moving from 78.97 in Jun-22 to 81.34 in Sep-22) despite heavy intervention by the RBI. With INR weakening by a further 1.7% in Oct-Dec quarter of 2022-23, we expect BoP deficit to have persisted, albeit at a moderate level.
While this would reduce the pressure on INR, bias for mild weakness is nevertheless likely to persist. As such, we expect USDINR to trade close to 83.5 levels by Mar-23, and towards 85.5 levels by Mar-24.
BoP deficits have always caused depreciation in INR
| Year | Size of BoP Deficit (% of GDP) | Change in USDINR (%) |
| 1995-96 | -0.3 | 8.0 |
| 2008-09 | -1.8 | 26.3 |
| 2011-12 | -0.8 | 14.3 |
| 2018-19 | -0.1 | 6.3 |
| 2022-23* | -1.1 | 7.9 |
* BoP deficit for 2022-23 is our forecast. Change in USDINR in 2022-23 is as of Jan 17th.
What should the Exporters Do ?
- Be watchful of Buyer credit worthiness given the heightened uncertainty and volatility expected during the next 12 months across interest rates, commodity prices and weakening demand in Buyer Countries.
- Diversification of Buyer Geographies is the dominant theme: Middle East esp. Saudi Arabia, UAE etc. seem to be performing quite well. South East Asia overall seems to be impacted far lesser as compared to western economies.
- Avail Factoring or Credit Insurance (private or Govt. ECGC) without fail on all exports.
Footnotes:
1. The Baltic Dry Index is a comprehensive measure of cargo rates for capesize, panamax and supramax shipping vessels carrying dry bulk commodities.
2. Balance of Payments (BoP) is the net dollar flow position into the country on account of current account (trade, repatriation, interest & dividend income) and capital account transactions (foreign investments, external commercial borrowings, banking capital, etc.).
Website: https://www.quanteco.in/

Who moved my exports and exchange rate?
As per the World Trade Organization, growth in global merchandise trade volume is expected to slip to 1.0% in 2023 (slowest since the initial COVID outbreak in 2020) from 3.5% in 2022.
Who is pulling down India’s exports?
The global merchandise trade environment is looking sombre due to multiple shocks:
- US: Aggressive monetary policy tightening would hit interest-sensitive spending in areas such as housing, motor vehicles and fixed investment.
- Europe: High energy prices stemming from the Russia-Ukraine war will raise manufacturing costs and squeeze household spending.
- China: Slowdown in real estate sector and COVID related uncertainty is weighing upon supply chains.
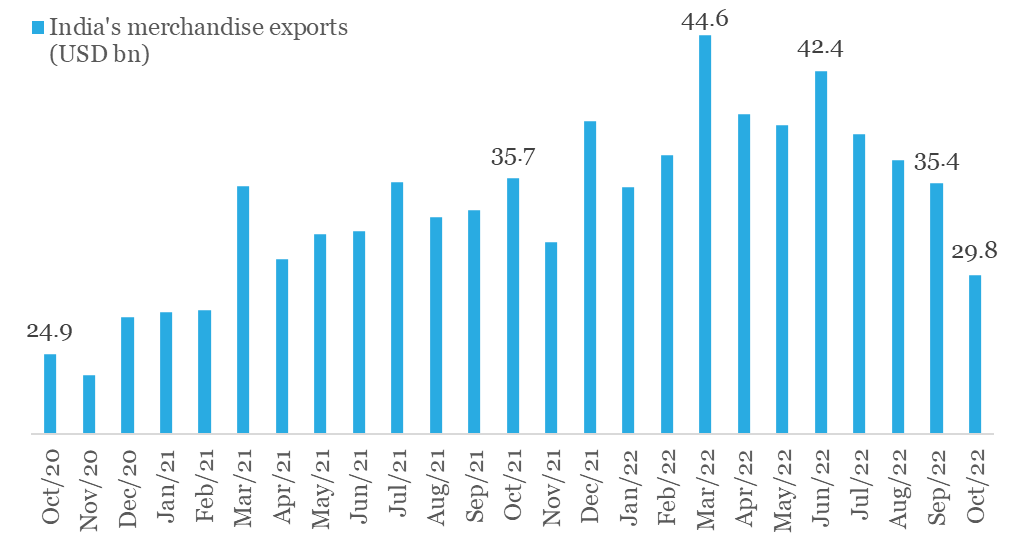
For India, the second half of FY23 started on a cautious note as far as external trade is concerned. While both exports and imports have eased from their respective monthly peaks, the slowdown in exports is concerning.
- From its monthly peak of USD 42.4 bn in Jun-22, exports are down by ~30% to USD 29.8 bn in Oct-22
- For the first time in 20-months, monthly exports fell below USD 30 bn in Oct-22
- Exports posted their first annualized contraction (-16.7% YoY) in last 20-months
India’s exports have been easing since its FY23 monthly peak in June
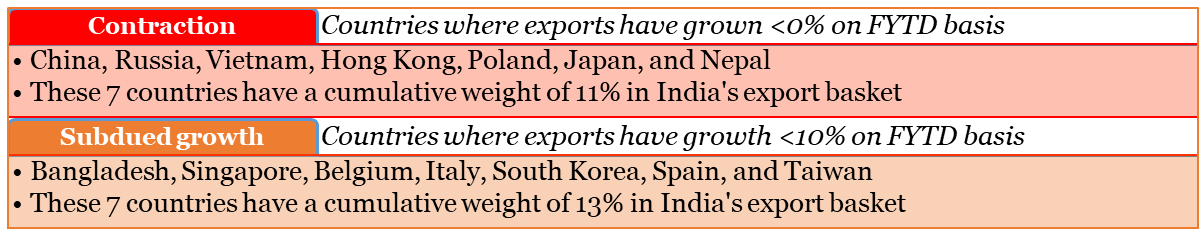
Focusing on key countries (having more than 0.5% share in India’s exports), we find that drag on India’s exports in FY23 so far is coming from:
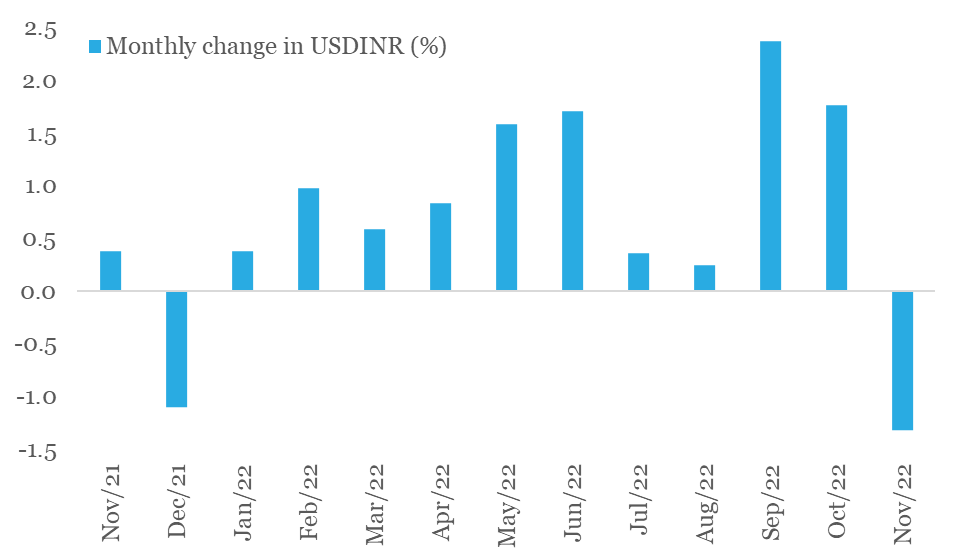
FX commentary
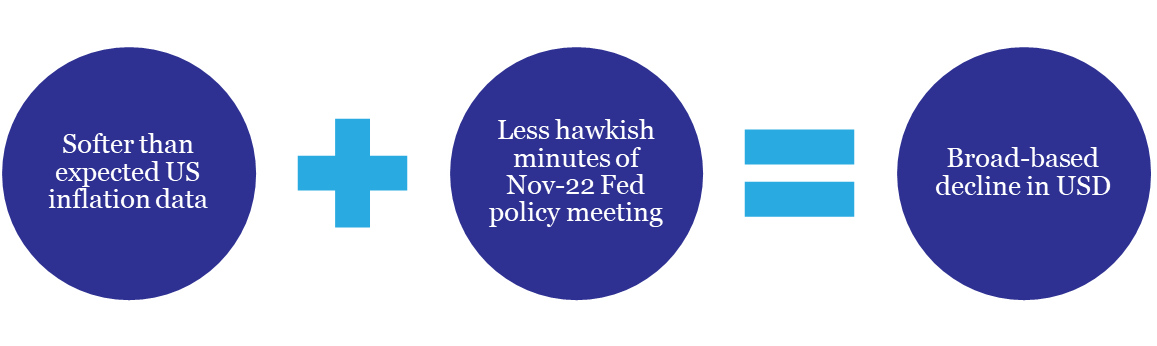
With Nov-22 drawing to an end, we cannot help but notice the first monthly appreciation in Indian rupee after a gap of 11-months. This happened on the back of a broad-based decline in the US dollar (the DXY Index has fallen by 5.1% in Nov-22 so far, making it the worst monthly loss for the dollar in over 12-years).
While the down move in DXY index has been swift, we are not convinced of its durability yet:
- Although market participants now anticipate the Fed to prune its aggression by dialing down the pace of rate hike to 50 bps in the next couple of meetings from 75 bps in last four policy meets, expectations with respect to the terminal fed funds rate (i.e., peak monetary policy rate in the current cycle) have moved up to 5.00-5.25% from 4.50-4.75% earlier (as per the last median forecast provided by the Fed in Sep-22).
- Going into 2023, the Fed will reduce its balance sheet by a further USD 1.1tn, way ahead of any other major central bank. This mop up of global dollar liquidity would continue to support the USD.
- Build-up of relatively higher recessionary risks in Europe and elevated geopolitical risk premium could sporadically boost safe haven appeal of the USD.
As such, we expect residual pressure on rupee to persist, albeit to a mild degree. Our fundamental view on USDINR is guided by our call of USD 130 bn deficit on India’s current account deficit in FY23, accompanied by USD 50 bn deficit on Balance of Payments (i.e., current account deficit adjusted for total net capital inflows).
INR poised for its first monthly gain in 2022
Website: https://www.quanteco.in/
